Linear Regression
- Namrata Kapoor
- Sep 6, 2020
- 2 min read

Updated: Sep 9, 2020
When we try to represent relationship between variables, one of them is determining factor and other is explanatory, it is called Linear Regression.
The one which is determining factor is called Independent variable while the other is called dependent variable.
If there is only one dependent variable it is called Simple Linear Regression.
Let us try to explain this by a very simple example, Income of family and expenditure.
The expenditure of family is dependent on the income of family.
So, here income is the independent variable and the expenditure is dependent variable.
Let us explain it through a graph.
If there are 5 families and they decide to spend at least 50% of their income and all have same mindset , then this can be called a very simple Linear Regression.
In ideal case, things seem like below:


Here, the difference between predicted value and real value is 0. Which is the most ideal condition but unlikely to happen.
We choose a line on linear regression which has least sum of square of difference between predicted and actual values.
Error= Sum of ((y-y')**2)
Error should be least for the best slop of line of linear model to be selected.
The ideal model as above is called deterministic model. However, deterministic model examples are like conversion models where Celsius is converted into Fahrenheit. Where there is no other factor to be determined and just conversion formula.
Let us see below for some values which has some deviation from 50% spending.


This variation can happen because of various reasons and mindsets of families.

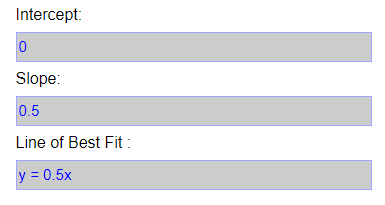
Intercept here is Value of Y axis when x is 0. And slop is determined by y/x.
Residual Analysis
Randomness and unpredictability are the two main components of a regression model.
In above case there can be factors which cannot be determined and which brought about change in expenses of families.
May be there could have been emergencies, or extravagance or saving streak.

