When One Score Isn’t Enough: Building a Daily, Time-Aware SOFA Dashboard in Tableau

Introduction
In my previous blog, When One Score Tells the Whole Story: Patient level SOFA Analysis with Tableau LODs, I explored how aggregating SOFA scores at patient level can be a powerful way to summarize sepsis severity across an entire ICU population. By using patient - level LOD expressions, the dashboard provided a clean, high level view of who was sickest and how severity was distributed across patients. Here is the link to my previous blog. From here you can understand about SOFA scores, Sepsis and how Sofa is related to Organ Dysfunction level and Mortality risk. https://www.numpyninjaacademy.com/post/when-one-score-tells-the-whole-story-patient-level-sofa-analysis-with-tableau-lods
However, that approach came with an important limitation: it was never intended for clinical decision - making. By collapsing time and reducing a patient's ICU stay into a single severity score, the dashboard has masked the day by day progression severity, reversibility of organ dysfunction or early sign of deterioration - elements that are critical for clinical monitoring sepsis in real time.
This follow up blog addresses the gap. It focuses on designing a time aware, clinician - ready SOFA dashboard
What Clinicians Actually Need From a SOFA Dashboard
Clinicians do not use SOFA scores as static summaries, they use them as a signal over time. At the bedside, the critical questions are not only how severe organ dysfunction is, but when it emerged, how quickly it is progressing, and whether it is responding to the intervention. Without visibility into daily trends and component-level changes, even accurate scores can mislead. For SOFA to support clinical action, it must reflect time trajectory, not just aggregated severity.
From Summary to Surveillance: Building a Daily SOFA View in Tableau
Once we accept that SOFA must be interpreted over time, the analytical question shifts from “Who is sickest overall?” to “How is this patient evolving, day by day, and which organ system is driving the change?” To answer this, the dashboard must be re-designed around daily ICU granularity rather than patient-level aggregation.
Design Principle for Clinical Ready SOFA Dashboard
Designing a SOFA dashboard for clinicians requires a fundamental shift in priorities —from summarization to surveillance. First, the dashboard must be time based, presenting SOFA scores at a daily ICU level rather than collapsing them across an entire stay. This approach will enable the daily basis clinical monitoring. Second, the dashboard should maintain one patient, one day structure.
Equally important is component-level transparency. Individual organ scores must be visible. So that if the sofa scores are changing it will clearly visible which biomarker is causing it and which organ needs the close monitoring.
Along with the Sofa component and total sofa score we need the Delta Sofa, which is going to tell the story about whether there has been any change in patient condition compared to the previous day. With the clear color code for delta SOFA, clinician can have a quick glance over the patients Dashboard, positive Delta is telling that total sofa of the patient has gone up compared to the previous day, which is a worsening sign. Similarly, negative Delta will tell, Patient total sofa score is less than the previous day, which shows positive improvement. Zero means no change from the previous day.

In this Blog I will walk through the Steps, How to build a clinical ready Daily sofa score dashboard :
Step 1: Define the correct Data Grain - One Patient one ICU day
The foundation of a clinically meaningful SOFA dashboard is grain discipline. Each row should be a single assessment point. The target is to showcase ”What was the SOFA score for the patient on the 3rd or 4th day.”
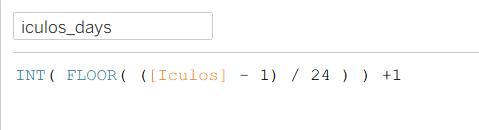
In the dataset, Iculos is given in hours. So, here we are converting Iculos from hr to days in the Tableau Calculated Field. Here we can check the Worst score every 24 hrs, but as per the Monitoring need we can showcase even more frequent Dashboard.
Step 2: Compute Daily Sofa Component
Each SOFA component (Respiratory, Liver, Cardiovascular, Renal, Coagulation) should be calculated at the daily level, using ICU day as part of the logic.
At this stage:
Avoid FIXED [Patient ID] LODs
Let Tableau compute values per patient per day
This preserves natural clinical sequencing
This is the biggest conceptual shift from my previous blog:
We are intentionally not summarizing yet.
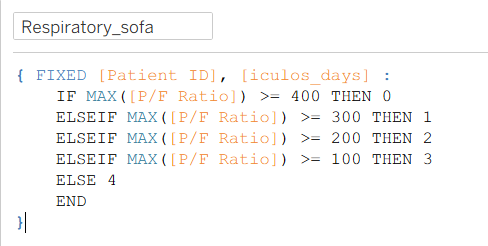
(A). Respiratory Sofa :The respiratory part measures lung impairment using the PaO2/FiO2 ratio (oxygen levels in blood vs. oxygen being given) for the Unique Patient and ICU days. It's a critical component of the overall SOFA score (0-4 points)
(B.) Liver: It is a clinical tool used in ICUs to observe liver function(hepatic) by assessing bilirubin levels, which helps predict patient outcomes, especially in severe liver disease, acute liver failure, or sepsis. It is a critical component of the overall daily SOFA score(0-4 points).

(C.) Cardiovascular: It measures Mean Arterial Pressure(MAP). It is a critical component of overall daily SOFA score(0-4 points).

(D.) Renal: It scores kidney function from 0 (normal) to 4 (severe dysfunction) on daily basis. The renal part specifically uses creatinine levels or urine output to assess kidney health, helping doctors monitoring illness severity and potential mortality in critically ill patient.

(E.) Coagulation: Here the coagulation component specifically measures blood clotting ability, usually based on the patient's platelet count on a daily basis, grading the severity of dysfunction from 0 to 4 point. It's a critical component of the overall SOFA score(0-4 points).

Step 3: Total SOFA Score
Now we have sofa components scores, we can easily build the total sofa of unique patient on a daily basis.

Step 4: Delta SOFA – Capturing Day-to-Day Clinical Change
while the daily total SOFA score shows the severity of organ dysfunction at a given point in time, it does not indicate whether the patient is improving or deteriorating. Delta SOFA addresses this gap by calculating the difference between today's total SOFA score and previous ICU days for the same patient. A positive Delta SOFA signals worsening organ dysfunction, a negative value indicates clinical improvement, and zero reflects no meaningful change- making trajectory, not just severity, immediate visible.

Steps 5 how to built the table I have mentioned in my previous blog, link of that is given in the introduction section.
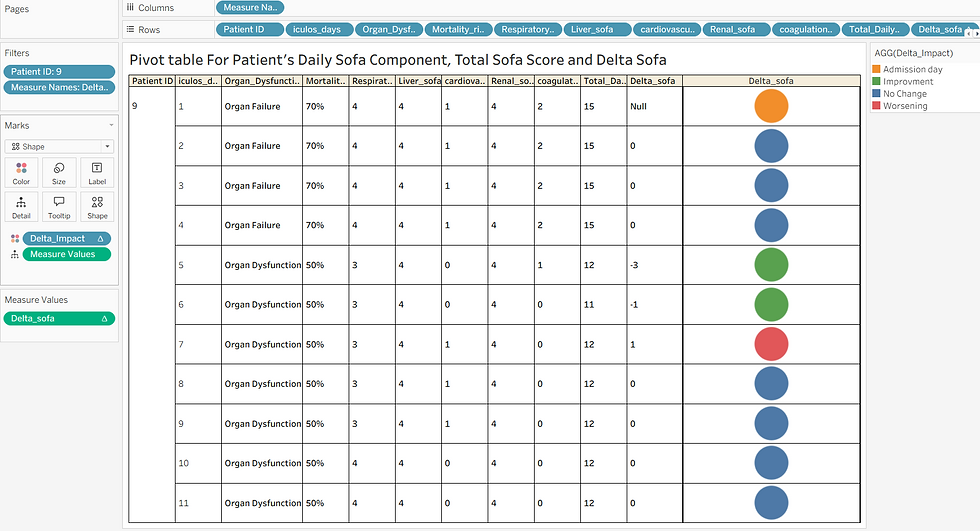
This Table gives us detail information about the patient condition and it is ideal to keep at Patients bedside to clinician have a quick information about the condition over the time.
Patient-Level Trends in Total SOFA Score Across ICU Stay
Along with the individual patients status clinician also need to know which patient does need more close monitoring. This chart visualizes individual patient trajectories of Total SOFA scores across their ICU stay. Each line represents a unique patient, showing how organ dysfunction evolves day by day. The x-axis captures ICU length of stay in days, while the y-axis reflects the Total Daily SOFA score, a composite measure of organ failure severity. By comparing these lines, clinicians and analysts can identify patterns of deterioration, stability, or recovery across different patients.

When to Use Patient-Level vs Time-Aware SOFA Dashboards
Patient-level SOFA dashboards and time-aware SOFA dashboards serve fundamentally different purposes and should be used in complementary ways. Patient-level aggregation, built using LOD expressions, is well suited for population-level analysis, retrospective reporting, and risk stratification across large cohorts. It provides a concise summary of overall severity and is valuable for research, benchmarking, and quality improvement initiatives.
In contrast, time-aware SOFA dashboards are designed for clinical monitoring and decision support. By preserving daily ICU snapshots and organ-specific trajectories, they align with how clinicians assess evolving organ dysfunction at the bedside. These dashboards support early detection of deterioration, evaluation of treatment response, and prioritization of high-risk patients.
Why Clinical Analytics Must Respect Time
SOFA was never designed to be a static number. It is a dynamic clinical tool intended to be monitored, interpreted, and acted upon as organ function evolves. While patient-level aggregation can offer valuable retrospective insight, clinical decision-making depends on timing, trajectory, and change. When analytics collapse time, they risk obscuring the very signals clinicians rely on to intervene early.
Clinician-ready dashboards must therefore do more than summarize data—they must preserve clinical context. By respecting the temporal nature of SOFA scoring, analytics need to move beyond description and begin to support meaningful, timely action in the care of patients with sepsis.


