When One Score Tells the Whole Story: Patient-Level SOFA Analysis with Tableau LODs

Introduction:
In critical care analytics, how we calculate metrics is just as important as what we visualize. One of the most widely used severity scoring systems in ICU settings is the SOFA (Sequential Organ Failure Assessment) score. While SOFA is conceptually simple, implementing it correctly in Tableau might be challenging. Because there might be the same patient Id with and their biomarker will appear multiple times in the dataset with the different value.

Here is the link for the dataset:
Here is the link to help you understand the dataset:
SO, the question is: What is the SOFA score? What does it mean and why is it so important?
The SOFA (Sequential Organ Failure Assessment) score is a clinical tool used in intensive care to assess a critically ill patient's organ function (respiratory, cardiovascular, liver, coagulation, renal, neurological) and predict their risk of mortality, with higher scores indicating worse organ dysfunction and increased likelihood of death, especially useful for monitoring sepsis progression. It's calculated based on common lab results and clinical data, providing a simple, standardized way to track organ failure severity over time, not just a single snapshot.
SO Here comes another question, What is sepsis?
Sepsis is a life-threatening medical emergency where the body's extreme, overactive response to an infection damages its own tissues, organs, and systems, potentially leading to organ failure and death. It's a chain reaction to an infection (like pneumonia, UTI, or skin infection) that causes widespread inflammation, low blood pressure, and reduces blood flow, starving organs of oxygen and nutrients. Quick treatment with antibiotics and fluids is crucial for survival, as it can progress rapidly from mild symptoms to severe complications
How do we calculate the Sofa Score?
Sofa Score is build on 6 Sofa component score:
Respiratory Sofa
Coagulation Sofa
Liver Sofa
Cardiovascular Sofa
Renal Sofa
Neurological Sofa (In this dataset, this is not available. So, we will ignore this.)
In this blog, I walk through a step-by-step, clinically sound approach to building:
Total SOFA scores
SOFA Component Score per patient
A scalable Tableau visualization that works for one or many patients.
Based on the Sofa score we are going to build the Organ Dysfunction status
Mortality Risk percentage.
Since we are working with the Level Of Detail of patient Id, we are going to work with the worst sofa score to avoid any chance of missing out any possible sepsis situation for the patient.
Respiratory Sofa: The respiratory part specifically measures lung impairment using the PaO2/FiO2 ratio (oxygen levels in blood vs. oxygen being given). It's a critical component of the overall SOFA score (0-4 points)

Coagulation: The coagulation component specifically measures blood clotting ability, usually based on the patient's platelet count, grading the severity of dysfunction from 0 to 4 points. It's a critical component of the overall SOFA score (0-4 points)

Liver : It is a clinical tool used in ICUs to observe liver function (hepatic) by assessing bilirubin levels, which helps predict patient outcomes, especially in severe liver disease, acute liver failure, or sepsis. It's a critical component of the overall SOFA score (0-4 points) .

Cardiovascular : It measures Mean arterial pressure (MAP).It's a critical component of the overall SOFA score (0-4 points) .

Renal : It scores kidney function from 0 (normal) to 4 (severe dysfunction). The renal part specifically uses creatinine levels or urine output to assess kidney health, helping doctors monitor illness severity and potential mortality in critically ill patients.
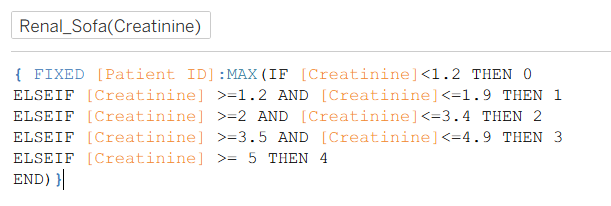
Now we have all the Sofa components, but there is a problem the way we have handled the calculation. We did not handle the null values while calculating the sofa components. So if any component has a null value is going to make the entire sofa score as null.
Eg: (Null + 4+1+3+0) = Null
6. Total Sofa Score: We will handle this situation while calculating the total sofa score:

Here the ZN function converts any null value to zero before performing any arithmetic calculation.
Organ Dysfunction level: Now we have Total sofa, based on this score we are going to calculate Organ Dysfunction Level. Higher Sofa gives more dysfunction level.

8. Mortality Risk Percentage: Clinician determines the level of critical illness based on sofa score, it is also associated with the mortality percentage risk.

We do have all the necessary calculations now, we will be creating the visual for the worst sofa score for the individual patients.
Step1: Put Patient Id, Organ_Dysfunction, Mortality_Risk to the row shelf and filter a few patients from the dataset for clear visibility.
Step 2: Put one by one 5 sofa components and Total sofa score onto the row shelf, first change them to dimension and then again change to discrete, it will create a blue pill in the row shelf for each sofa component. It will create each column for each.
Step 3 :.Drag Measure Name to column shelf(filter Total_Sofa_Score)
Step 4: Put Measure Value to details(Filter Total_Sofa_Score)
Step 5: Drag total sofa score to column change to attribute.

This chart presents a patient-level SOFA (Sequential Organ Failure Assessment) profile, created using a Level of Detail (LOD) calculation fixed at Patient ID and computed over the entire available dataset.
By fixing calculations at the Patient ID level, the view ensures that each patient has one consolidated SOFA snapshot rather than multiple time-based or encounter-based records.
This sort of visualization is good for:
Population-level severity profiling
Retrospective analysis
Comparing overall burden across patients
Educational and exploratory dashboards
But where it is not helping the clinician?
Real-time clinical decision-making
Treatment response monitoring
Prognostication without temporal context
Another approach to do this work by adding another level of detail to patient id iculos days, and we can calculate the daily sofa score, and delta sofa(difference in sofa score in two consecutive days) would let the clinician know if any change in patient condition from previous day.
Stay tuned for next part where we will see, how this kind of dashboard can help clinician in quick decision making and provide immediate intervention to critical condition patients.


