Monitoring And Observing The Data With Smarter Alert -Using Tableau
- Gunashree Ramachandran
- Jan 9
- 7 min read

Updated: Jan 11

Story of Monitoring In My World

“Monitoring “
"Ahh" This is the Word I started my career 12years ago as a Reporting Analyst in Networking & Telecom Industry. During that time, as a fresher I always wonder why we need to monitor each calls and send report to Engineers manually every hour? As days go by ,Sorry!! As years went by, so many questions.??

A person came into my life to clarify This word “Monitoring “in IT Industry. You all wonder who Is that Person yeah, he is my life partner. He was a Monitoring and observability SRE. Whenever he talks about office work, he will mention Monitoring alert in his calls and mobile pop-up alert. I used to ask him why he is getting these alerts always and even at midnight. He used to tell his job is to Design and build monitoring solutions to support different types of monitoring like application performance, System health, alerting. After that I was curious to get into the field again where I started my career. Due to different opportunity I took a break in my career and after 12 years gap I got an opportunity to restart my career as an ‘Data Analyst’ in Numpy .I started my first step In Tableau learning .I had an great experience and gained good knowledge in one of the data visualizations tool still Learning .while I was writing my first blog in tableau I asked my partner tell me some topics to write my first blog .

I Don’t know what is blog???.
He suddenly came into the idea of “alert”. He asked me whether you have an option of alerting in tableau.? I said, I don’t know I just completed my basic concepts of tableau. Even if it’s present, I don’t have any idea how to explore it because I am at beginner level. So , Started with my first blog with very simple concept of “inserting the Image in tableau “.

As days go, I started my very first Sepsis Project in Tableau, in that one Sprint I got “Email alert for trigger Hour of Sepsis /Sirs Patient” I volunteered myself from my team and explored how to set up alert when Patient met some SIRS criteria it was really good and I was curiously exploring for two days to get alert and I have troubleshooted my mistakes and learnt new things . I was very happy when I first got alert to my mail Id about the Patient condition with Vitals.
From the Sepsis Project email alert work, I noticed an issue, when we click icon only doctors receive a patient alert, why do the system itself does not send automatic alert when patient reach SIRS level. Same Question was asked by partner. Then I started to Explore more about tableau monitoring and alert to observe the data in stored data.

I learnt the concept of “data driven alerts “while I was analyzing both Live and stored(extract) data set. I explored with tableau Cloud. Finally, I came to the solution of Writing the Second blog about Automating alerts and system monitoring in tableau. This is how the Word “monitoring -alert “played in my career.
Technically What is Meant by Monitoring?
Monitoring is an approach interconnected with an alerting system. This approach notifies team members if any critical events occur or if specific thresholds are reached within the system.

Why Data Analyst need Monitoring?
In Today’s Analysts world, Dashboard are no longer just a reporting tool it’s an intelligent system that surface the insights. In Tableau the data driven alerts automatically monitor the key metrics, and which will notify users when thresholds which we set are crossed. Instead of manually checking dashboards, teams receive timely, actionable insights delivered straight to their inbox. Recently, all industries like software, Health, Restaurant, Banking, tourist etc. operate in different culture and environments where technology like AI changes the world rapidly. Waiting for weekly or monthly reports can mean missed opportunities or delayed responses. In fast-growing condition everyone needs an alert in all systems that will fasten system performance and analyze the reports easily.
To Solve we need a Data alert by considering the below
conditions
This Automatic data alert Reduces the manual monitoring and Tableau watches your metrics for you
Due to that Improving response time data alerts trigger the moment thresholds are met the conditions.
Supports the operational workflows for the teams to act faster with real‑time signals.
Fatigue alerts can be prevented only when conditions truly change.
This helps us to find outages and downgraded performance situations to see how each is reflected by the tool.
Monitoring the data is simple method in tableau cloud to create the alert. I have used tableau Cloud Trial version to set mail alert.
Steps to Create the Data Monitoring alert
In this blog post I used the data set for analyzing the Automatic Data Driven Alert, AI JOB MARKET ANALYSIS from Kaggle.

I used this in tableau Cloud to find out how the industry level AI adoption is done and I need to check the Alert for the given data stored.
Step 1: Open Tableau Server/ cloud
Log in to your Tableau Server or Tableau Cloud account and navigate to the dashboard or worksheet where you want to set the alert. Remember, this must be a view that has already been published from Tableau Desktop.

Step 2: Have Your project Worksheet / dashboard be in Tableau Desktop/ Cloud .
To analyze I included “AI adoption level “and “Industry” in à Column
Dragged “Industry” in both -text and Color
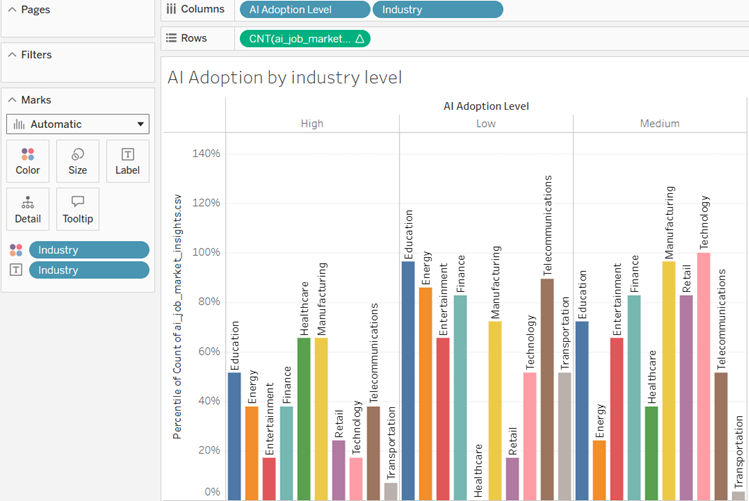
This Input gives the bar chart as output while continuously tracking the AI adoption across industries. And Sudden increase or drops in AI-related job postings can automatically trigger alerts. These alerts help identify industries as well as sectors lagging in AI readiness. This enables timely, proactive decisions for strategy and workforce planning.
Step 3
Once the dashboard is in tableau cloud, we can see Right Side Corner we have option like “Watch “Select “Watch” from the panel.


Tableau cloud allows the users to create monitoring alerts on a published view. Select the Alerts which are available under the watch menu. Anyone who is available to access view can see alerts created by others. Select the alert to see its details, including its threshold, schedule, and notification frequency.
Step 4:Configuration of monitoring Alert condition and Threshold Setup
We almost came to the main part of the alerting and here we set the logic of our monitoring alert. This configuration panel has several options to add.
Firstly, we need to set the logic that triggers the alert, under the condition we have “Is above “Is Below”, "Is Equal To," "Is Above or Equal To," or "Is Below or Equal.
Secondly, Set the threshold value where the condition trigger.

It watches a key metric the percentile of job counts in AI Job which reflects how certain roles or industries are compared to others. When this percentile crosses 0.85, meaning it's in the top 15% of observed values, the alert condition becomes true.
Step 5
Next comes like “Subject for the mail” where we are going to get the alert, we can include any subject line depending on our requirement., Next option is an when we need to receive an alert. We have option of “When the Condition is true, Send alert “. Final Option is “Recipients” we should include users id /Mail id whom we need to notified when threshold met the condition.

Instead of flooding our inbox we can configure the alert to notify “daily at most”, striking a balance between timely updates and avoiding alert fatigue. Depending on the Scenario we can change the condition. For this analysis I included for “Daily “in case of medical industry reports we can include “Hourly basis “or “as Frequently as “.
The recipient will get data alerts only when the condition is true, helping her stay informed about surges in hiring trends or market shifts. This kind of setup is ideal for dashboards that track dynamic data. It ensures that stakeholders when something meaningful happens like a spike in demand for AI roles without checking manually dashboard every day.
Step 6
Finally , Once the alert is created , and when it met the threshold condition met , automatically receive the monitoring mail in the mail .


In this way Tableau Cloud turns our dashboards into self‑monitoring intelligence systems. Instead of manually checking whether a KPI crossed a critical threshold, Tableau Cloud watches the data for you and automatically sends alerts the moment something important happens.
This AI job‑Adoption email alert is a perfect example for our alert monitoring system.
In this Six Steps, we saw how the tableau generates automatic alert, but we have some glitch also to be considered before setting up the alert. This Alert works only for the numeric Axis data. Not for Names in Axis.

Manage and Edit the Tableau alert in Cloud:
We just created alert, over the time we need to manage, edit and even we can remove alert depending on the need of any requirements. Tableau cloud has an option of having an option easily.
Active alert
Quickly check which alerts are active and whether anything has recently been triggered.
Edit Alert
Select an alert and click the "Edit" option to change its threshold, recipients, or frequency.
Managing the User
You can assign one of your alerts to another user if a project or responsibility is handed over Depending on the project need and requirement.
Delete Alert
If an alert is no longer relevant, you can temporarily pause it or permanently delete it to stop receiving notifications. We can regularly clean the unwanted alerts.
We can see all the alerts that we own, by navigating to your My Content area and selecting the Alerts tab.

Conclusion
Automating the data alerts transform raw data into timely, actionable insights. By continuously monitoring key metrics, alerts trigger instantly when thresholds or patterns are breached. This reduces manual effort and ensures faster response to critical changes. As a result, organizations can act proactively, improving accuracy and decision-making efficiency. This is what I explored about monitoring the data with alert setup.

