EXCEL: THE FOUNDATION OF DATA ANALYTICS
- Abirami Ramasubramanian
- Jan 12
- 5 min read

Using Excel to Analyze Daily Banking Operations – A Real Time Case Study

As we discussed in the previous blog, Excel is one of the most beginner-friendly tools in Data Analytics. It allows you to experiment with ideas, explore data, and understand patterns without feeling overwhelmed by complex tools or coding.
Because of this simplicity and flexibility, I chose Excel as the primary tool for this project. It gave me the freedom to apply what I was learning and turned real-world problems into practical insights. Almost everyone gets a chance to work with Excel at some point. If you’ve already used it, now let use it the right way.
Let me ask you a simple question.
Have you ever used Excel to:
Maintain reports?
Track numbers?
Update daily or monthly data?
If your answer is yes, then you’ve already taken your first step into Data Analytics.
For many non-IT professionals, Excel feels like a routine tool used for basic work. But in reality, Excel is much more than just rows and columns. It’s where raw numbers start turning into meaningful insights.
With Excel, you don’t need coding skills or technical knowledge. You just need curiosity:
Why did this number increase?
What changed this month?
Which product or process is performing better?
Excel helps you ask these questions and find answers in a simple, visual, and logical way. It builds your confidence and prepares your mindset for more advanced techniques and tools like (SQL and Tableau).
That’s why almost every Data Analyst especially those from non-IT backgrounds starts with Excel.
It’s familiar. It’s powerful. And it’s the perfect place to begin.
Excel: Simple on the Surface, Powerful Underneath
At first glance, Excel may look simpler. Many people see it as just a basic tool for entering numbers. But once you go a little deeper, you’ll realize how powerful Excel actually is.
Excel comes with important features like Pivot Tables, Formulas/Functions, Power Query, and DAX. These tools help you clean data, combine multiple files, analyze large datasets, and create meaningful reports with ease.
What might surprise you is this many leading organizations still rely on Excel for their daily operations, reporting, and decision-making. Even today, Excel plays a critical role in banking, finance, and business analytics.
So, while Excel may look simple on the surface, it’s a tool that continues to power real-world analytics across industries.
Why I Chose Cash Management in Banking for My Excel Mini Project
During my years as a bank teller, one of the biggest daily challenges was managing cash flow. Some mornings, customers would flood in, and we’d suddenly find ourselves short of cash at one counter and overloaded at another.
By the end of the day, we would be balancing piles of notes, making sure everything matched perfectly and sometimes, it didn’t.
That’s when I started thinking: What if we could see these patterns clearly before the day even began?
When I began learning data analytics, I decided to turn that question into a project something that could actually make day-to-day banking operations smoother.
The Idea Behind the Project
I wanted to create a simple tool to help financial organizations understand daily cash inflow and outflow patterns how much cash was coming in, how much was going out, and whether we were holding too much or too little at the counters.
I chose Excel for this project because it is already familiar in the banking environment, and I knew it had powerful features beyond just data entry.
Tools and Methods Used
I built this project using:
Excel Pivot Tables to summarize daily transactions.
Formulas like SUMIFS, VLOOKUP, Count IF etc., to automate calculations.
Conditional Formatting to instantly highlight days when cash balances crossed safe limits.
Power Query to clean and combine data from different days.
An interactive dashboard displaying daily inflow, outflow, teller performance, and closing balance trends.
By following these steps, I transformed raw, unorganized data into clear, actionable insights all using Excel techniques that are beginner-friendly yet powerful.
How I Converted Raw Data into Meaningful Insights in Excel
Once I had my tools and methods ready, here’s how I turned raw banking data into meaningful insights using Excel:
1.Loading Data Using Power Query
I imported daily transaction files from multiple sources into Excel.
Power Query made it easy to combine all the files into a single dataset, so I didn’t have to copy-paste manually every day.
2.Cleaning Data Using Filters and Techniques
Raw data often has errors or unnecessary details.
I used filters, removed duplicates, and text/number corrections to clean the dataset.
This ensured that only accurate and useful information was included for analysis.
3.Pivoting Monthly Data Based on Each Employee
I created Pivot Tables to summarize daily and monthly transactions for each teller.
This helped me see patterns like who processed the most transactions, busiest days, and where cash was over or under stock.
4.Deriving Results Using Formulas
I used formulas like SUMIFS, IFS, LOOKUPS to calculate totals, compare expected vs actual cash, and highlight trends.
These formulas turned the raw numbers into actionable insights.
5.Creating the Final Dashboard
Once the data was cleaned, summarized, and calculated, I designed an interactive dashboard.
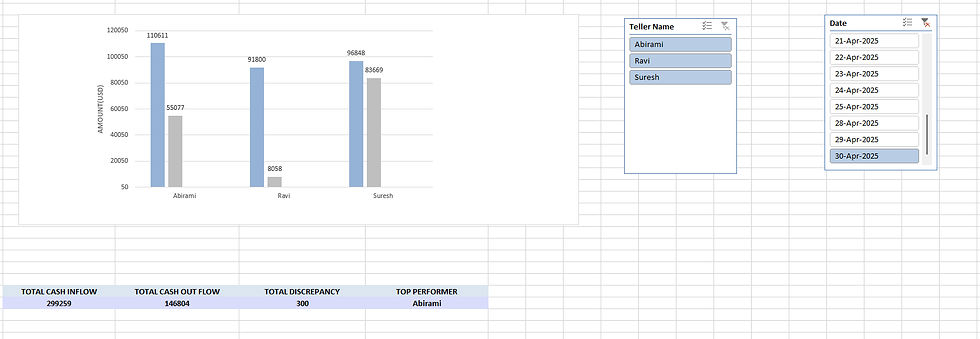
It displayed daily cash inflow and outflow, teller performance, and closing balances.
I used Pivot Charts, Conditional Formatting, and slicers to make it easy to see patterns at a glance.
Here’s a snapshot of my Excel dashboard showing daily cash inflow, outflow, and teller performance using sample data.
What I Discovered
Once I started analyzing the data, some interesting patterns appeared.
Certain weekdays consistently showed excess closing balances, indicating the need for better vault transfers.
Teller-wise comparisons also revealed small differences in transaction volumes, which could be useful for better coordination and training.
What I Learned
This project was more than just Excel practice it was about connecting my banking experience with my new data analytics skills.
I learned how data can turn everyday challenges into clear, actionable insights.
More importantly, it gave me the confidence that I can take real world problems and solve them using analytical thinking, not just manual effort.
Final Thoughts
My Bank Operation Management project reminded me that data analytics isn’t just for tech companies or large systems. Even a simple Excel dashboard can make a real difference in how we work.
For me, this project became the perfect bridge between my past in banking and my future in data analytics. It proved that meaningful insights often come from the tools we already have as long as we know how to use them differently.
In the upcoming blog, we will explore how SQL can be used in another banking mini project, taking our analysis to the next level with larger datasets and more advanced insights.
Call to Action
If you’re starting your data analytics journey, try building something from your own work experience. You’ll be surprised by how much insight your data holds—just like I experienced. And stay tuned for the next blog, where we’ll dive into SQL for banking operations analytics!
#DataAnalytics #ExcelDashboard #BankingAnalytics #DataDrivenDecisions #WomenInData #CareerTransition #DataAnalyst #ExcelProject #BankingExperience #DataVisualization