Design Smarter: Images, Shapes & Links in Tableau Made Easy for Beginners
- Gunashree Ramachandran
- Nov 13, 2025
- 2 min read

Updated: Jan 8
Tableau is more than just a data visualization tool—where data meets creativity. Whether we are building dashboards for stakeholders or crafting interactive reports, customizing images, shapes, and hyperlinks can elevate our work from functional to phenomenal. This is my first blog, I get you all through how to personalize Tableau dashboards with visuals more engaging and intuitive.

In this post, we’ll walk through:
How to add and style images for branding .
How to use custom shapes to make data pop.
How to insert hyperlinks that guide users to deeper insights
No coding required—just smart design choices that elevate dashboards from functional to fantastic. Let’s dive in and make Tableau dashboards not just informative, but unforgettable. I have chosen Car logo personalized data set.
Adding and Customizing Images in Tableau
Insert Images in Dashboards
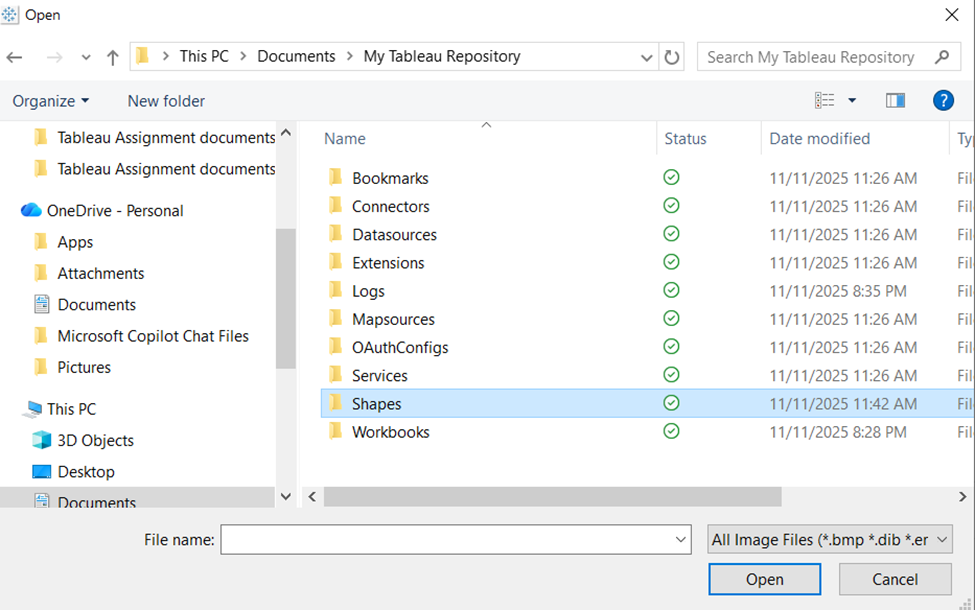
Choose an image file (PNG, JPG, etc.) from C:\Users\Documents\My Tableau Repository\Shapes
Before selecting from shapes we need to browse and download the shapes and images that we need for our dashboard .
I selected the Car images for an example we can download any image depending on the need .
Open your dashboard.
Drag an Image object from the dashboard pane which is present bottom left side .


Click the Choose and select image file from the source ---->My Tableau Repository

Resize and position it as needed in Dashboard.

Using Custom Shapes in Tableau
Step-by-Step
Save shape icons in:
Documents → My Tableau Repository → Shapes → [Folder Name]
In worksheet:

Drag a dimension to the Shape mark.

Click the Shape legend and select your custom folder.

Assign shapes to each category.

After assigning shapes to corresponding name we can see the images in the sheet .

Insert hyperlink in Dashboard-Action URL
By inserting hyperlinks, you transform dashboards into more interactive and informative platforms, facilitating deeper data exploration and more informed decision-making. Links can provide additional context or supplementary information related to the data presented in your dashboard and also Provides seamless access to external resources, detailed reports, or additional data sources directly from Dashboard. It Enables users to perform live searches or navigate to specific URLs based on the data they interact with.
Let’s explore how to create a hyperlink in Tableau that directs users to a Google search .
URL Actions
Go to Dashboard → Actions → Add Action → Go to URL.

Add URL Action

Web Page Objects
Drag a Web Page object onto the dashboard.
Link it to a URL action to display external content directly.

Here comes the URL link, opens the Webpage and can use the content. I have used the Wikipedia of car brands in my link .we can use any URL Link according to the dataset .

Conclusion
Customizing images, shapes, and hyperlinks in Tableau helps you build dashboards that are not only informative but also Improves usability and engagement across teams and stakeholders it highlights the key metrics or categories with intuitive shapes .Whether a beginner or a seasoned data explorer, these design elements can transform how users interact with data.

