Building and Deploying a Streamlit Dashboard: A Complete Step-by-Step Guide
- saranyashanmugam200
- Jun 1
- 4 min read
When I started working on a diabetes dashboard data, I wanted something simple: a clean web app where I could explore data, detect outliers, visualize patterns, and run a machine learning model with a known and easy language python.
Streamlit is a remarkable Python library that lets you turn a normal Python script into a fully interactive web application.
In this blog, I’ll walk through everything I did — from installing packages, building the app, adding caching and navigation, and finally deploying it from GitHub.
Installing a necessary packages
We need essential python libraries as we are dealing with Data science visualization and machine learning projects
Understanding the Fundamentals of Streamlit:
Before building the project, I learned some important features of Streamlit, which helped me structure the project correctly.
Streamlit runs the entire script Top to Bottom,Every time a user interacts with a widget (like a button or dropdown , which creates the interactivity to the application), Streamlit re‑executes the script. This is why caching is important
Cache:
Caching stores the output of expensive operations (like reading a CSV) so Streamlit doesn’t re-run them every time the user interacts with the app. Reading CSV file repeately slows down the app.
To avoid reloading the dataset again and again, we use @st.cache_data.
It stores the result the first time and reuses it, making the app faster.

Streamlit also used HTML and CSS
i have used that for the header, navigation menu and background color .
Widgets:
Widgets are the key to creating dynamic and user-friendly interfaces to allow users to input information, control the app's behaviour, and explore data in real time. They are interactive elements like buttons, sliders, text input boxes, dropdown menus and more. Streamlit provides a wide array of pre-built widgets that we can use in our applications (Text input boxes , button, sliders, dropdown, checkboxes, radio buttons, Fileuploaders).
Some of them are action widgets, so elements like button will trigger the action when clicked . For any kind of interactions these buttons are crucial like in here detecting outliers ,applying filters
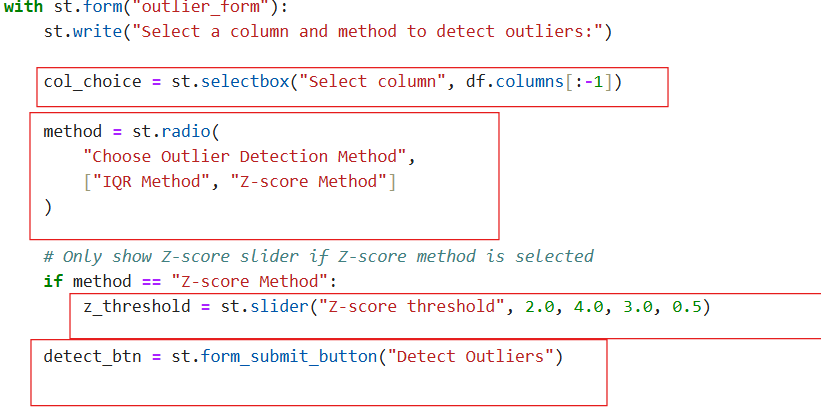
Forms in Streamlit:
One of the most useful and cool feature i learned while buliding this project was the forms .
We understood already anytime we change the value and dropdown or slider or checkbox default it will run the entire script ,which it not required in somecases .grouping all the input widgets in single form and after submission it will trigger the run which avoids unnecessary reruns, there will be more control over the calculation and it will give faster performance this i tried in this project at the outliers part where the user will select the method and column clicks the detection to get the result.


Step 1 : List of app dependencies
Many libraries has been installed for the project (pandas, matplotlib, numpy , ploty, scipy, scikit learn)
Those are called the libraries our app will work if we install this
list them in a separate text file as requirements(requirements.txt)


NumPy handles numerical operations.
Pandas is used for reading CSV files, cleaning data, and creating DataFrames
I used SciPy for statistical operations — especially Z‑score outlier detection.
Scikit A powerful machine learning library. I used it for:
Train‑test split
Random Forest model
Accuracy score
Confusion matrix
Matplolib &Seaborn:These libraries are used for static visualizations like:
Histograms
Boxplots
KDE plots
Heatmaps
Plotly :used for interactive visualizations, here i used for interactive scatter plot
Streamlit : Streamlit is a remarkable Python library that allows us to create web applications with just a few lines of code.
(Other than this openCV and Pillow are commonly used for image processing but in this project in dint use .)
App willonlu work if the above dependencies are installed.
Streamlit Cloud will install that from the requirements.txt file automatically.if this file is missed it will fail to deploy.
Step 2. Host your code in repository on GitHub
Source code should on the dedicated repository
If the source code changes it will automatically trigger the deployment process and update the live
Under the repo the project file app.py that is the python code for running to get dashboard should be added , it should be in the root folder not in the subfolder, then the dataset file (csv or excel) then requirements.txt file
Please note( the repo should be public for the automatic reflection, also the file name should be in low case as it is case sensitive)

Step 3
(create an account in https://streamlit.io) . After creating the account. Create a “New app” on the streamlit

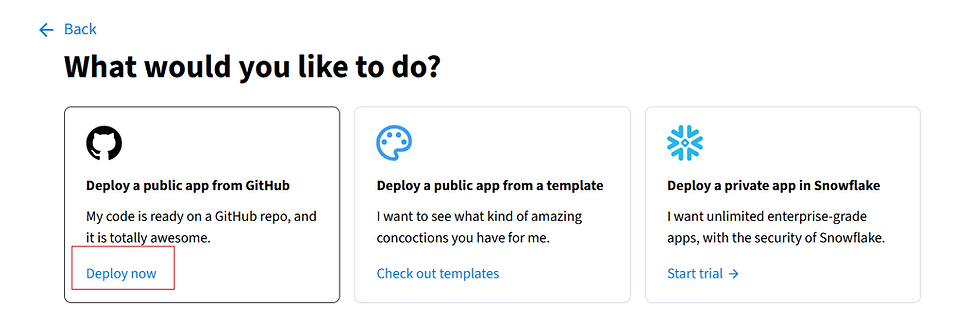

Create app , then it automatically displays the repo and you can select the repo and the branch and the the app file that is given in the github will reflect that you can connect and and click Deploy. That’s it you are done , your dashboard is ready and shareable with URL
Here is my URL have a look
what happens after the deploy? Whenever you make changes to the code it will automatically trigger the file to rerun and it also uses the cache for the data loading .and if any requirement is missing you will be getting Modulenotfound error check and add it .incase the file is miss placed not it the root folder it will not reflect on the deplyment.also the file are case-sensitive, make sure to correct that as well. Then, if the app crashes, check the Mnage app button to check the logs and correct it .
Final Thoughts:
Building this diabetes dashboard taught me how powerful and beginner‑friendly Streamlit is. I was able to:
Load and clean data
Detect outliers
Visualize patterns
Build a machine learning model
Add navigation and styling
Deploy it online
All using pure Python.

