Why Power Bi is an Exciting Analysis Tool: The Magic of DAX
Power BI is widely regarded as one of the most powerful and intuitive data visualization tools available today. One of the key reasons behind its popularity is its integration with DAX (Data Analysis Expressions), a powerful language designed specifically for data analysis. DAX is the heart of Power BI, enabling users to create complex calculations, perform deep data analysis, and uncover insights that would be difficult or impossible to achieve with basic aggregations alone.
What is DAX in Power BI?
DAX (Data Analysis Expressions) is a formula language specifically designed for data analysis and creating custom calculations, aggregations, and expressions that go beyond the capabilities of standard formulas or built-in functions. DAX is the key language for creating measures, calculated columns, and calculated tables in Power BI, enabling dynamic data analysis and reporting.
Key Features of DAX:
Calculations in Power BI: DAX allows you to perform complex calculations that go beyond simple sums and averages. For example, you can calculate year-to-date (YTD) totals, create running totals, calculate the difference between current and previous periods, and perform many other advanced analytical tasks.
Dynamic Context: DAX formulas are sensitive to the context of your data. This means that the calculations are automatically adjusted depending on the filters or slicers applied to your Power BI report. For example, if you have a report showing sales by region and apply a filter for a specific year, DAX formulas will adjust dynamically to reflect only the sales for that year and region.
Measures and Calculated Columns:
Measures: These are dynamic calculations that are recalculated based on the report context, such as when a user applies filters or slices the data. Measures are typically used for aggregate values like total sales, average cost, etc.
Calculated Columns: These are calculated at the row level when data is loaded into Power BI and are not affected by filters. They are useful for creating new fields based on existing columns, such as categorizing data or performing conditional logic.
Time Intelligence: DAX includes built-in time intelligence functions that allow you to perform date-based calculations. These functions make it easy to calculate things like Year-to-Date (YTD), Month-over-Month (MoM), Same Period Last Year, and other time-based metrics.
Powerful Functions: DAX offers a wide variety of functions, including:
Aggregation functions (e.g., SUM, AVERAGE, COUNT)
Filter functions (e.g., FILTER, ALL, ALLEXCEPT)
Logical functions (e.g., IF, SWITCH)
Mathematical functions (e.g., ROUND, ABS, DIVIDE)
Date and time functions (e.g., DATEADD, MONTH, YEAR, TODAY)
Relationship-Driven Calculations: DAX can work with the relationships defined in the Power BI data model to pull in data from multiple tables and compute values across those relationships. This is important when you have normalized data models with multiple related tables (e.g., Sales, Customers, Products).
In this blog, we will explore several common but essential tasks in Power BI that demonstrate how DAX can be used for data analysis, especially in the context of healthcare data such as patient records.
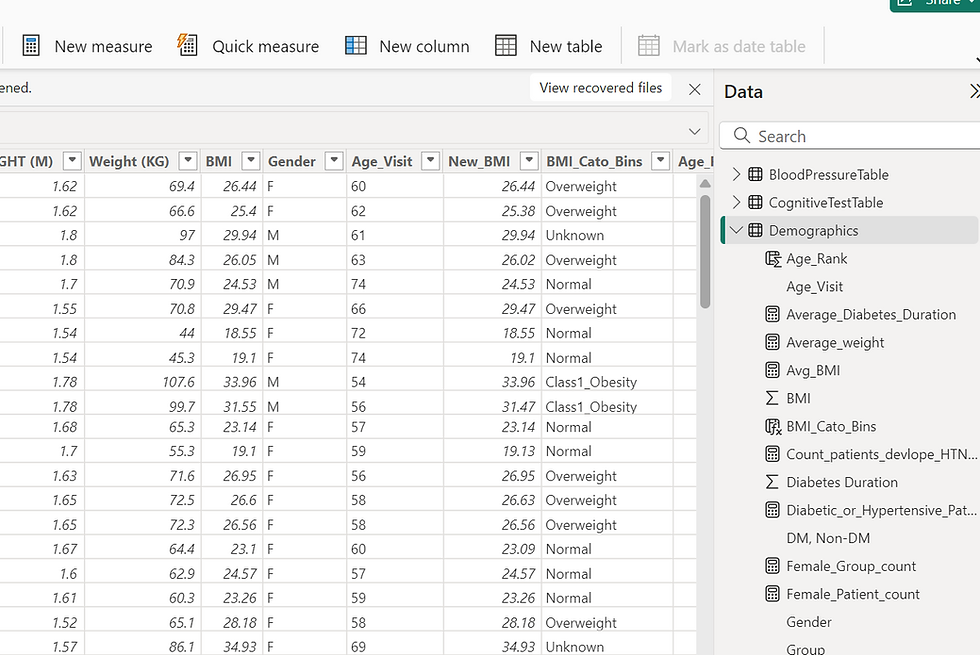
1.Categorizing BMI of Patients – Using Bins and Without Using Bins
BMI (Body Mass Index) is a common metric for assessing whether a patient is underweight, normal weight, overweight, or obese. In Power BI, you can categorize patients based on their BMI in two ways:
Using Bins
Power BI provides a feature called Bins that automatically categorizes data into ranges. Here's how you can categorize BMI into groups using bins:
Create a Measure for BMI.
Right-click on the BMI field and choose New Group.
In the Grouping dialog, select Bin Size to define the intervals (e.g., 5 for BMI ranges like 18.5–24.9, 25–29.9, etc.).
Without Using Bins
You can also categorize BMI using DAX, by creating a Calculated Column to assign categories based on BMI ranges:
BMI_Category = IF([BMI] < 18.5, "Underweight", IF([BMI] < 24.9, "Normal weight", IF([BMI] < 29.9, "Overweight", "Obese")))
This DAX expression checks the value of BMI and assigns the corresponding category.
2. Classify Patients According to BP Ranges
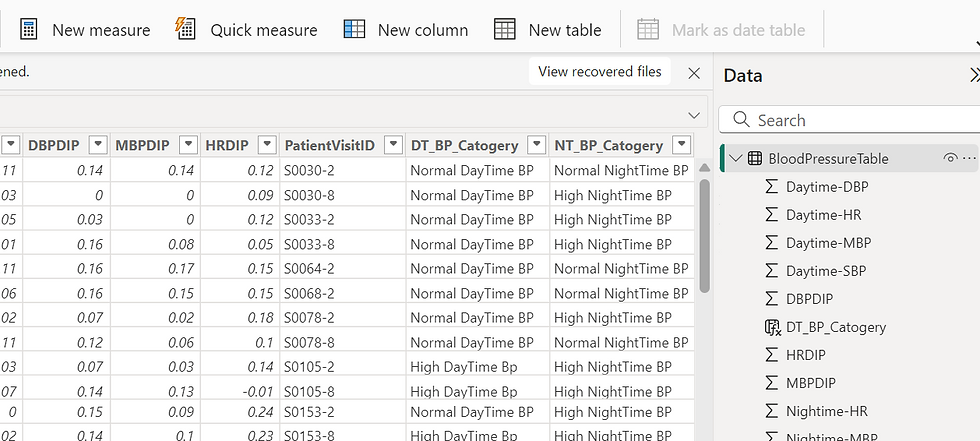
Blood pressure is a critical measure of a patient's health. You can classify patients into different groups based on their Systolic and Diastolic blood pressure readings using DAX. Here's how you can define categories:
BP_Category = SWITCH(TRUE(), [Systolic] < 120 && [Diastolic] < 80, "Normal", [Systolic] >= 120 && [Systolic] < 130 && [Diastolic] < 80, "Elevated", [Systolic] >= 130 && [Systolic] < 140 || [Diastolic] >= 80 && [Diastolic] < 90, "Hypertension Stage 1", [Systolic] >= 140 || [Diastolic] >= 90, "Hypertension Stage 2", "Hypertensive Crisis" )
This SWITCH function classifies the patients into categories based on their BP ranges.
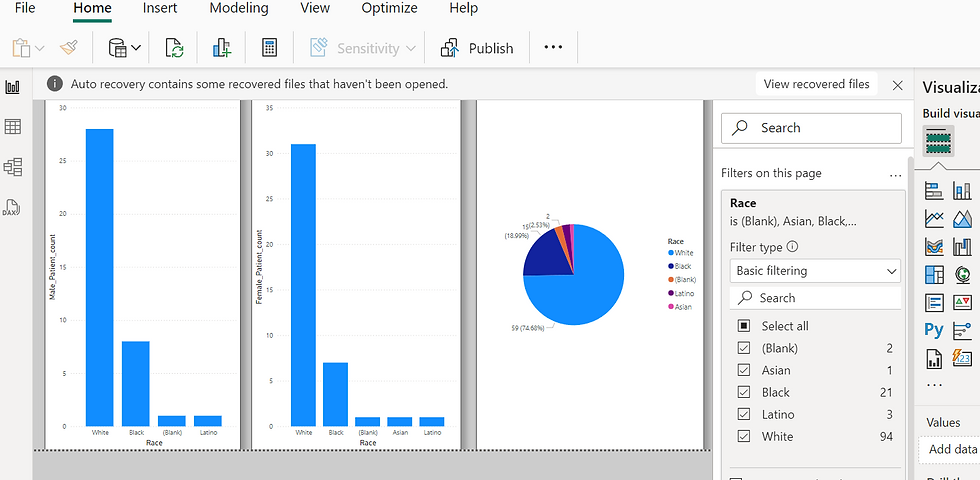
3. Count the Number of Patients Grouped by Gender
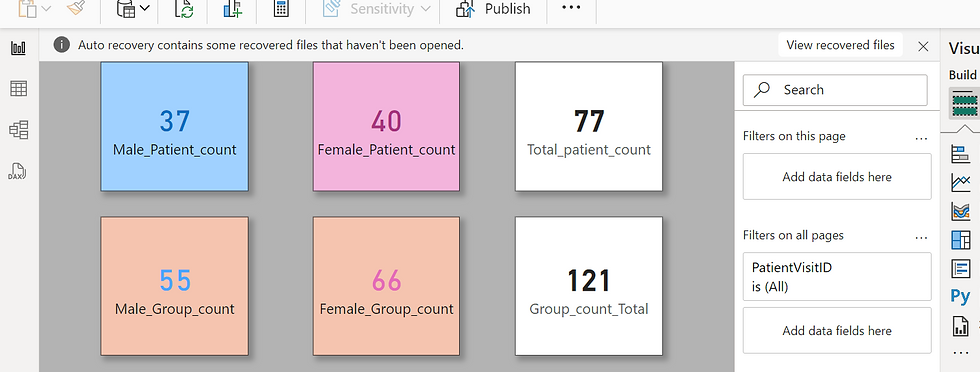
Counting patients and grouping them by gender can be easily done using DAX measures and the COUNTROWS function.
For instance, you can create a measure that counts the number of patients for each gender:
Patient_Count_By_Gender = COUNTROWS(FilteredTable)
In the Visualizations pane, you can group the data by gender to show the count of male and female patients.
4. Difference Between COUNT and COUNTROWS
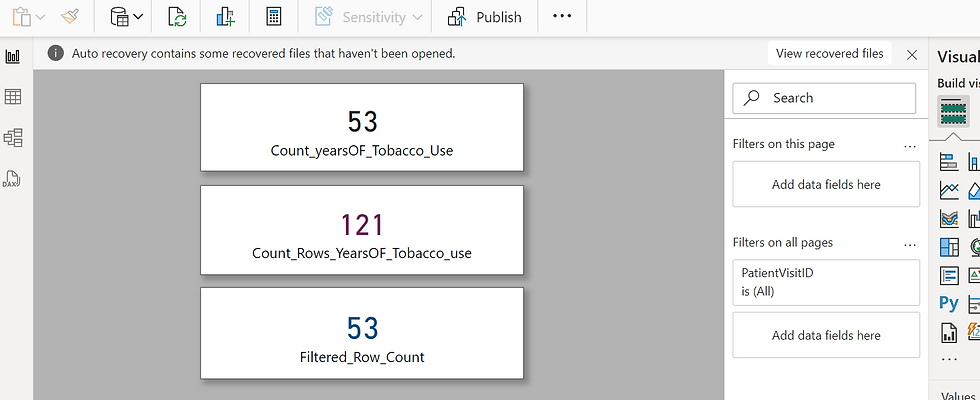
In Power BI, COUNT and COUNTROWS are similar but used in different scenarios. Here’s the difference:
COUNT: This function counts the number of values in a column, excluding blanks. It's used for counting data in a single column.
COUNT(YourColumn)
COUNTROWS: This function counts the number of rows in a table or a filtered table.
COUNTROWS(YourTable)
Example: If you have a table of patient data, COUNT can be used to count non-blank entries in a single column, while COUNTROWS counts the total rows in the entire table.
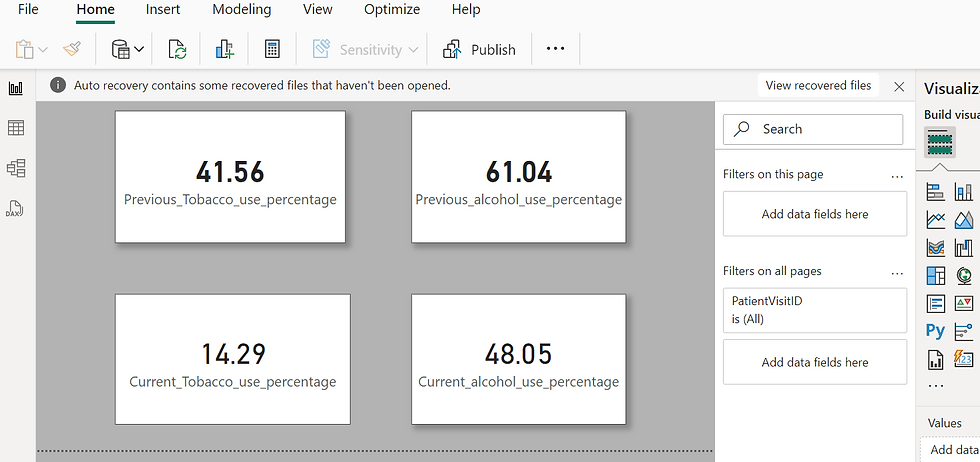
5. Calculate the Percentage of Patients Who Used Tobacco and Alcohol
To calculate the percentage of patients who used tobacco or alcohol, you can use DAX measures:
Tobacco_Usage_Percentage = DIVIDE( COUNTROWS(FILTER(Patients, Patients[TobaccoUsage] = "Yes")), COUNTROWS(Patients) ) * 100
Alcohol_Usage_Percentage = DIVIDE( COUNTROWS(FILTER(Patients, Patients[AlcoholUsage] = "Yes")), COUNTROWS(Patients) ) * 100
These DAX measures divide the count of patients who use tobacco or alcohol by the total number of patients, multiplied by 100 to get the percentage.
6. Find the Number of Patients with Kidney Disease Using Alb/Creatinine Ratio
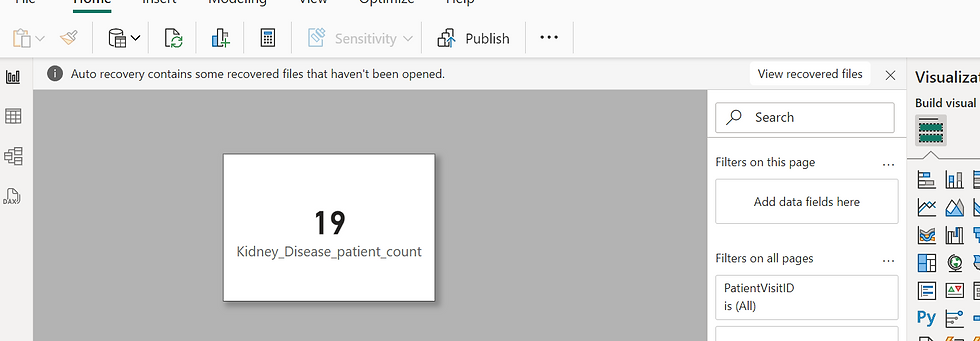
The Albumin/Creatinine Ratio (ACR) is used to assess kidney function. You can create a calculated column to determine if a patient has kidney disease based on their ACR value.
Kidney_Disease = IF([ACR] > 30, "Yes", "No")
Then, to count patients with kidney disease, use:
Count_Kidney_Disease = COUNTROWS(FILTER(Patients, Patients[Kidney_Disease] = "Yes"))
This counts the number of patients with an ACR greater than 30, which is typically considered indicative of kidney disease.
7. Calculate Mean, Median, and Mode of Any Lab Results
To calculate statistics like Mean, Median, and Mode for lab results, you can use DAX measures:
Mean (Average):
Mean_Lab_Result = AVERAGE(Patients[LabResult])
Median:
Median_Lab_Result = MEDIAN(Patients[LabResult])
Mode: Power BI does not have a built-in mode function, but you can create a workaround using EARLIER and CALCULATE to find the most frequent value.
8. Measure vs. Calculated Column
A Measure and a Calculated Column are both used for calculations but serve different purposes:
Measure: A measure is a dynamic calculation based on context. It is recalculated each time the user interacts with the report (e.g., filtering, slicing).
Example: Total patients using distinct count of patient_id
Calculated Column: A calculated column is a static value that is computed at the row level when data is loaded. It is stored in the table and doesn’t change with filters or interactions.
Example: BMI Category based on BMI ranges.
Key Difference: Measures are used for dynamic, aggregate calculations, while calculated columns are row-level calculations.
9. Rank the Patients by Their Age and Order Them by the Youngest
You can rank patients by age using the RANKX function in DAX:
Age_Rank = RANKX(ALL(Patients), Patients[Age], , ASC)
This ranks patients from the youngest to the oldest (ASC for ascending order).

10. Explore Visual Level, Page Level, and Report Level Filters in Power BI
In Power BI, filters can be applied at three levels:
Visual Level Filters: These filters apply only to a specific visual (e.g., chart or table).
Page Level Filters: These filters apply to all visuals on a specific page of the report.
Report Level Filters: These filters apply to all visuals in the entire report.
Each type of filter is accessible in the Filters pane and is useful for refining the data shown in your visuals at different levels.
11. How Many Patients Are Either Diabetic or Hypertensive?
To count the number of patients who are either diabetic or hypertensive, you can create a DAX measure:
Diabetic_or_Hypertensive = CALCULATE( COUNTROWS(Patients), Patients[Diabetes] = "Yes" || Patients[Hypertension] = "Yes" )
This measure uses the CALCULATE function to count rows where a patient has either diabetes or hypertension.

12. Examples Using Aggregate Functions
Here are two examples using aggregate functions in Power BI:
SUM: Calculate the total cost of treatments for all patients.
Total_Treatment_Cost = SUM(Patients[TreatmentCost])
AVERAGE: Calculate the average age of patients.
Average_Age = AVERAGE(Patients[Age])
Conclusion
Power BI, coupled with DAX, enables powerful data analysis and visualization capabilities. Whether you're categorizing BMI, classifying patients based on their BP ranges, or calculating the percentage of patients using tobacco or alcohol, DAX provides the flexibility and functionality to handle complex calculations. By mastering DAX functions like COUNTROWS, CALCULATE, and RANKX, you can easily perform in-depth analysis and gain meaningful insights from your data.
The ability to work with measures, calculated columns, and aggregate functions allows for dynamic reporting, while the use of filters ensures that you can tailor your reports and dashboards to specific needs.
If you're looking to take your Power BI skills to the next level, mastering DAX is the key!


