WHO GET SIRS AND WHY? A DEMOGRAPHIC DEEP DIVE
Updated: Jan 13
INTRODUCTION:
Systemic Inflammatory Response Syndrome (SIRS) is a critical condition that signals the body's response to inflection, trauma or other inflammatory triggers. While SIRS is often discussed in the context of sepsis, it is a broader physiological alarm system that can occur in many medical scenarios. But here's something we don't talk about enough SIRS does not affect all patients equally. Age and Gender play a major role in how frequently SIRS occurs, how severe it becomes, and how early it is detected. I am wondering to work with this project to get more depth knowledge about the severity in gender, here whatever I learned my knowledge sharing with you.
Understanding these demographic patterns isn’t just an academic exercise. It helps healthcare teams recognize vulnerable groups, anticipate complications, and improve patient monitoring. When we look closely at SIRS through the lens of age and gender, surprising trends begin to emerge — from why older adults are more susceptible to how biological differences between men and women influence inflammatory responses.
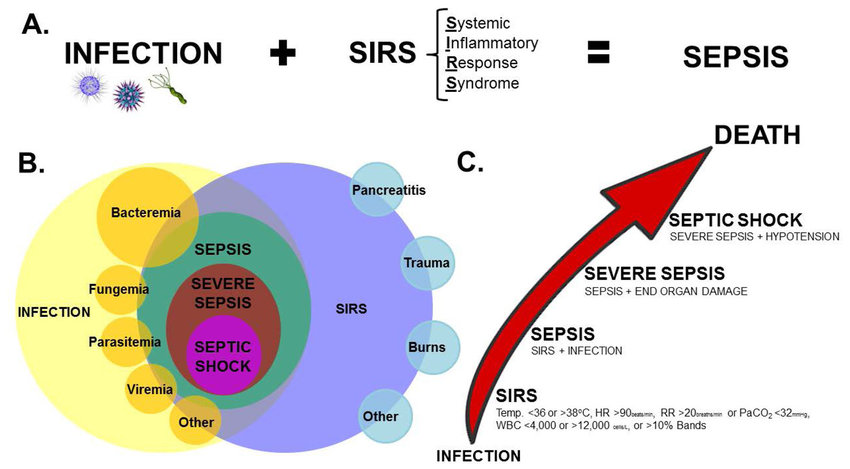
WHAT ARE SIRS AND WHY IT MATTERS?
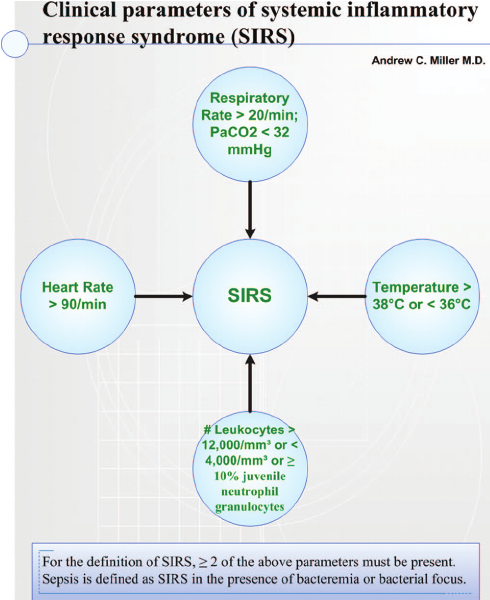
Elevated or low temperature
Increased heart rate
Rapid breathing
Abnormal white blood cell count
AGE SEGREGGATION:
Age is one of the strongest predictors of SIRS occurrence. when we break down SIRS counts by age groups, clear patterns.
CHILDREN: Younger patients often show strong immune responses. SIRS may occur due to infection trauma or congenital condition. Early symptoms may be subtle, making detection challenging.
ADULTS: SIRS in this group is often linked to lifestyle factors, injuries or acute inflections. This age group typically has lower SIRS count compared to the elderly.
OLDER ADULTS: This group consistently shows the highest SIRS counts. chronic disease (diabetes, COPD, heart disease) increase vulnerability. Immune system weakening make inflection more severe.
GENDER DIFFERENCE:
MEN: often show higher SIRS counts in middle and older age groups. Lifestyle factors (smoking, alcohol, occupational hazards) may contribute. some studies suggest men leave strangest inflammatory responses. Testosterone plays a major role in modulating the immune response. It tends to have an immune‑suppressive effect, which can influence how quickly or strongly men develop SIRS.
WOMEN: May shows lower SIRS counts in early adulthood but higher count after age 60. Hormonal changes, autoimmune conditions, and chronic illness influence risk. women may experience different diagnosis due to typical symptom presentation.
WHY USE BUTTERFLY CHART:

It is also known as population pyramid is a dual sided bar chart that compares two groups side by side perfect for visualizing male vs female SIRS counts across age groups.
How it works: The left side shows female SIRS count by age. The right side shows male SIRS count by age. The center axis lists age group (e.g.: 0-10, 10-20,20-30) which gender has higher SIRS counts at each age. Were the curves hidden (big difference) where they narrow (similar pattern) which age groups show the highest overall SIRS burden.
CALCULATED FIELD:
MALE: COUNTD(IF [Gender] = 1 THEN [Patient ID] END)
FEMALE: COUNTD(IF [Gender] = 0 THEN [Patient ID] END)
AXIS: 0
AGE SEGGREGATION:
IF [Age] >= 0 AND [Age] <= 10 THEN "0 - 10"
ELSEIF [Age] >= 11 AND [Age] <= 20 THEN "11 - 20"
ELSEIF [Age] >= 21 AND [Age] <= 30 THEN "21 - 30"
ELSEIF [Age] >= 31 AND [Age] <= 40 THEN "31 - 40"
ELSEIF [Age] >= 41 AND [Age] <= 50 THEN "41 - 50"
ELSEIF [Age] >= 51 AND [Age] <= 60 THEN "51 - 60"
ELSEIF [Age] >= 61 AND [Age] <= 70 THEN "61 - 70"
ELSEIF [Age] >= 71 AND [Age] <= 80 THEN "71 - 80"
ELSEIF [Age] >= 81 AND [Age] <= 90 THEN "81 - 90"
ELSEIF [Age] >= 91 THEN "91+"
END
SIRS COUNT:
COUNTD(IF [sirs criteria] =1 THEN [Patient ID]
END
)
SIRS COUNT BY DONUT CHART:
HERE we need to calculate the SIRS patient count distinction, then we need to make the pie chart using two dummy avg (0) make the two circle to synchronize and first circle add sirs count24,321 next we can the male /female mark as color. In that male as13,617 SIRS patient count and female as 10,704 SIRS count. seeing this difference male as more count then female in the donut chart. this is one more chart to explain the sirs distinct count here I am concluding male having the count is little high then female count.

CALCULATED FIELD:
MALE/FEMALE: IF [Gender] =1 THEN 'Male'
ELSE 'Female'
END
SIRS PATIENT COUNT:
COUNTD (IF [sirs criteria] =1 THEN [Patient ID]
END
)
WHY ITS EFFECTIVE:
Easy to compare two population visually
Highlights trends that tables or text cannot
Helps clinicians and administration make data-driven decisions
Ideal for presentation, dashboard and research reports.
CRITERIA FOR FOUR CATEGORIES OF SIRS:
Temperature > 38.5 or <36
Heartrate>90 beats/min
Respiratory rate >20 breaths /min or paco2<32mmhg
WBC>12000 cells/mm3 or <4000 cells/mm3 or > 10% immature(band)
WHAT THE BUTTERFLY CHART TYPICALLY REVEALS:
Higher SIRS count in elderly males.
A sharp size in SIRS after age 50 for both genders.
More balanced counts in younger age groups.
A widening gap between gender is middle age
THESE INSIGHTS HELP HOSPITAL:
Improve triage protocols
Allocate ICU beds more efficiently
Identify high-risk patient groups
Enhances early warning system
WHY THIS ANALYSIS MATTERS:
When clinicians know which group are most vulnerable, they can
Monitor vital sign more closely
intervene earlier
Reduce compilation
Improve survival rates
CONCLUSION:
SIRS is an early sign and analyze the pattern across age and gender helps healthcare teams respond faster and smarter. A butterfly chart is one of the most effective ways to visualize this difference making it easier to identify high risk groups and improve patient outcomes. Recognizing these demographic variations doesn’t just deepen our understanding of SIRS; it encourages more thoughtful interpretation of data and more personalized approaches in clinical settings.
By appreciating how gender and age influence inflammatory responses, we move closer to identifying at‑risk groups earlier, improving monitoring strategies, and supporting better outcomes. Ultimately, SIRS is not a one‑pattern condition. It is a dynamic response shaped by who we are, how our bodies function, and the unique biological factors we carry throughout life. I am glad here to conclude my knowledge to who started exploring my blog to get basic information about the SIRS.


