What are Dimensions and Measures in Tableau?
- kancharlaroopa03
- Jul 24
- 2 min read

Hi there! 👋
This is my first time writing a blog (ever!), and I wanted to share something I just learned in Tableau that totally confused me at first — but now it finally makes sense!
So, if you’re like me and just starting with Tableau, this is for you 😊
🌀 At First, It Was Confusing…
When I opened Tableau for the first time, I saw all these fields on the side.
Some were blue, some were green, and I had no idea what that meant.
Then I noticed two labels:
Dimensions and Measures.
I didn’t get it.
So, I googled. I watched videos. I tried dragging stuff around.
And finally — I figured it out in my own way.
Let me explain it simply.
🔹 What Are Dimensions?
Dimensions are like categories or labels.
They are the things that describe your data.
Examples of dimensions:
• Region (East, West)
• Product (Laptops, Phones)
• Customer Name
• Date
💡 You use dimensions to group or break down your data.
🧠 Example:
If you want to see sales by region, the region is the dimension.
🔸 What Are Measures?
Measures are numbers — the actual values in your data.
You can sum, average, or compare them.
Examples of measures:
• Sales
• Profit
• Quantity
• Discount
🧠 Example:
If you want to know how much profit you made, that’s a measure.
🎯 My Simple Trick to Remember
When I create a chart, I ask myself:
Is this a label or category? → That’s a Dimension
Is this a value or number? → That’s a Measure
📊 Quick Example
Imagine this table:
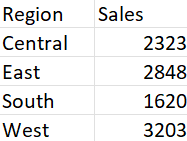
In Tableau:
Region is the Dimension (it divides the data)
Sales is the Measure (it's the value)
If you drag:
Region to Columns
Sales to Rows
You'll see a Bar Chart

💬 Final Thoughts
I’m still new to Tableau, and honestly, it looked scary at first.
But once I understood Dimensions and Measures, everything felt easier.
So, if you’re just starting out — don’t stress!
You’ll get it with a little practice.
Thanks for reading my first ever blog post!
Let me know if I should write more beginner-friendly Tableau blogs 😊


