Unleashing the Power of Data Power BI is like a Swiss Army knife for modern businesses—versatile, powerful, and surprisingly intuitive. Here's how it's making waves across industries

Updated: Sep 4, 2025
How Power BI Is Transforming Modern Business
In today’s fast-paced, data-driven world, businesses are constantly looking for ways to make smarter decisions, faster. Enter Power BI—Microsoft’s business intelligence tool that’s helping organizations of all sizes turn raw data into actionable insights.
But what exactly is Power BI, and how is it reshaping the way businesses operate?
What Is Power BI?
Power BI is a powerful data visualization and analytics platform developed by Microsoft. It enables users to connect to various data sources, transform messy data, create interactive dashboards, and generate insightful reports—all without needing to be a data scientist.
Whether you're a small business owner or a Fortune 500 executive, Power BI offers scalable tools to visualize trends, spot anomalies, and forecast outcomes.
Here's how it's making waves across industries:
Why Businesses Use Power BI
1. Data-Driven Decision Making
Power BI helps executives and managers move away from gut-feel decisions and instead rely on clear, data-backed insights. Interactive dashboards offer real-time visibility into KPIs, revenue, and customer behavior.
Example: A retail chain uses Power BI to track store-level sales performance and optimize inventory based on trends.
2. Self-Service Analytics
Gone are the days when every report request had to go through IT. Non-technical users can build reports with drag-and-drop ease.
Power BI’s intuitive drag-and-drop interface empowers business users to explore data, build custom visuals, and answer their own questions on the fly.
Benefit: Reduced dependency on technical teams and faster response times.
3. Integrated Data from Multiple Sources
Power BI can connect to Excel, SQL Server, Salesforce, SharePoint, and even cloud services like Google Analytics or Azure. This means businesses can bring all their scattered data into one unified view.
Use Case: A marketing team combines web traffic, campaign data, and CRM info to measure ROI across channels.
4. Cost-Effective and Scalable
Power BI offers a freemium model, with affordable Pro and Premium licenses, making it accessible to startups and scalable for enterprise-level deployments.
Key Features That Businesses Love
Interactive Dashboards (Data Visualization & Reporting): Create interactive dashboards and reports that turn raw data into clear insights. Think charts, maps, KPIs, and slicers that stakeholders can explore in real time. Filter data on the fly, zoom into specifics, and drill down into categories.

Real-Time Reporting/ Decision Making: With live data connections, businesses can monitor operations, performances, sales, or logistics as they happen—no more waiting for end-of-day reports.
Custom Visuals & AI Integration: Create rich visualizations or leverage AI tools for predictive analytics and natural language queries (“Ask a question” feature).

Mobile Access: Monitor business health anytime, anywhere, from your phone or tablet.
Real-World Applications Across Industries
Finance (Financial Analysis): CFOs use Power BI to track budgets, cash flow, forecast revenue, profitability in real time and analyze expenses with dynamic models that update automatically.
Sales & Marketing Optimization: Integrate CRM data to analyze customer behavior, campaign performance, and sales funnels. Spot trends and adjust strategies on the fly. Visualize pipelines, conversions, and territory performance.
Operations & Supply Chain Management: Monitor inventory levels, delivery performance, and supplier metrics. Predictive analytics help reduce downtime and improve efficiency.
Healthcare Analytics: Hospitals use Power BI to track patient data throughput, bed utilization, hospital performance, operational efficiency and staffing ratios—leading to smarter scheduling and better outcomes.


Manufacturing: Analyze production metrics, downtime, and quality control.
🛠 Real-World Examples
Industry | Use Case | Impact |
Retail | Store-level performance tracking | Reduced stock-outs by 30% |
Manufacturing | Predictive maintenance | Cut downtime by 40% |
Logistics | Last-mile delivery optimization | Improved delivery windows |
HR | Diversity & inclusion dashboards | Better retention of underrepresented groups |
Using Power BI effectively is all about combining smart design, efficient data handling, and user-focused reporting. Here’s a curated list of best practices to help you get the most out of it:
🧠 Data Modeling & Performance
Use a star schema: Simplifies relationships and improves performance.
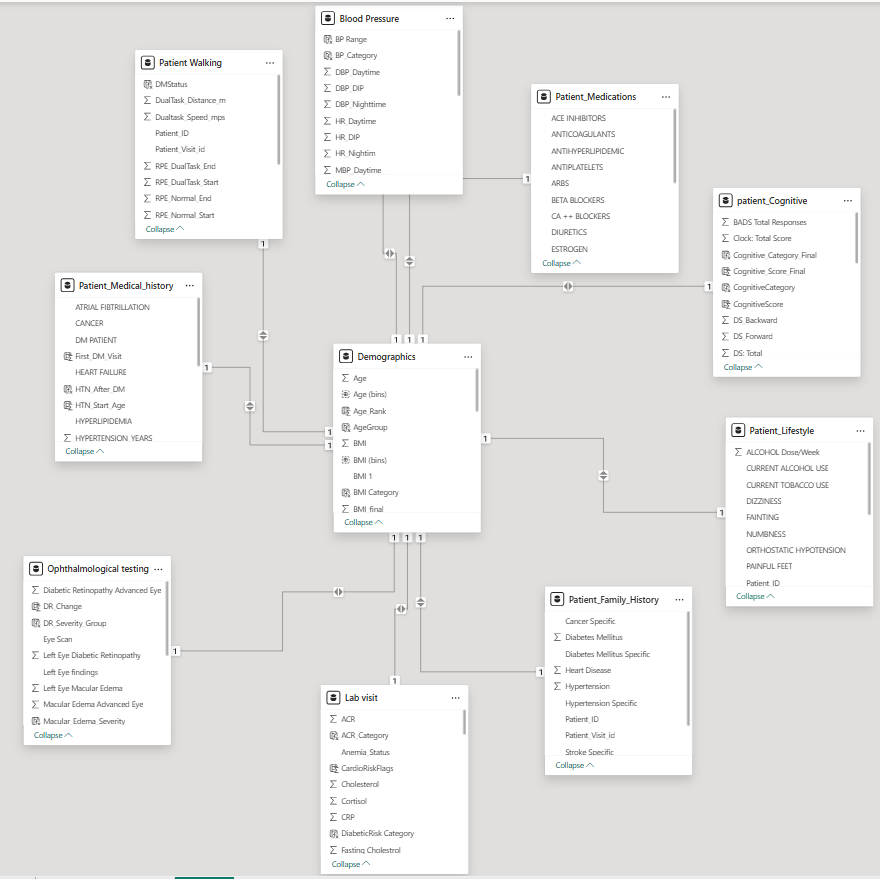
Avoid bi-directional relationships: Unless absolutely necessary, stick to single direction to prevent ambiguity.
Limit calculated columns: Use DAX measures instead—they’re more efficient and calculated at runtime.
Optimize data types: Choose appropriate types (e.g., whole numbers over decimals) to reduce memory usage.
Reduce data volume: Import only relevant tables and columns to keep models lean.
⚙️ Query & Loading Efficiency
Leverage query folding: Push transformations to the source system for faster data retrieval.
Use incremental refresh: Speeds up data updates for large datasets.
Enable parallel loading: Load multiple tables simultaneously to reduce refresh time.
🎨 Report Design & UX
Follow the 8–10 rule: Use no more than 8 visuals per report page and 10 tiles per dashboard to avoid clutter.
Choose the right visuals: Match chart types to data purpose—bar for comparison, line for trends, etc.
Standardize colors and themes: Consistency improves readability and reinforces branding.
Use tooltips and drill-throughs: Add depth without overwhelming the main report.
Optimize layout for mobile: Ensure reports are responsive and readable on smaller screens.
🔐 Security & Governance
Implement Row-Level Security (RLS): Restrict data access based on user roles.
Use certified custom visuals: Avoid third-party visuals unless they’re vetted for security.
Document your data model: Helps with maintenance and collaboration.
📈 Monitoring & Maintenance
Use Performance Analyzer: Identify slow visuals and optimize them.
Track usage metrics: Understand how reports are being used and improve accordingly.
Regularly update Power BI Desktop and Gateway: Stay current with features and security patches.
Challenges to Consider
While Power BI is powerful, it comes with a learning curve—especially around data modeling and DAX (its formula language). Businesses also need good data governance to avoid “dashboard overload” or misinterpretation of data.
Conclusion: Turning Insight Into Impact
Power BI isn’t just a reporting tool—it’s a strategic asset. By turning raw data into visual stories, it empowers businesses to spot opportunities, mitigate risks, and stay competitive in today’s data-driven economy.
Whether you’re just starting or already exploring analytics, Power BI offers a flexible, user-friendly path to smarter decision-making.


