Understanding the Difference Between Measures, Calculated Columns and Iterators in Power BI


When analyzing table data, the concepts of Measure and Calculated Column play a significant role in data analysis and visualization tools like Power BI. These concepts represent different approaches to processing and analyzing data, each with unique advantages that can enhance data analysis effectiveness. Let’s explore the differences between Measure and Calculated Columns in this blog.
What is a Measure in Power BI?
A Measure is a dynamic calculation that is computed only when needed, depending on filters and user interactions in reports. Measures do not consume extra storage space in your data model because they are not stored in tables. Instead, they are computed at runtime when Power BI refreshes visuals.
Example: Average BMI Measure
Let’s say you have a Demographics table with a column named BMI2. You can create a measure to calculate average BMI:




This measure will dynamically adjust based on slicers, filters, or selections in the report.
Advantages
Measures are ideal for performing aggregations such as SUM, AVERAGE, COUNT, MIN, and MAX. They are particularly powerful when you need calculations that respond to user interactions . For example, when applying filters by gender, race. Since measures are calculated only when required they help optimize performance by avoiding unnecessary storage and computation, making your Power BI reports faster and more efficient.
Disadvantages
Measures are not suitable for storing values at the row level, as they are calculated dynamically based on the current filter context rather than being tied to individual rows. Because measures do not physically exist in the data model, they cannot be used to create relationships between tables. If you need static, row-level data that can be used in joins or filters, a calculated column would be more appropriate.
What is a Calculated Column in Power BI?
A Calculated Column is a new column added to a table by applying a formula to each row. Unlike measures, calculated columns store values physically in the dataset, increasing memory usage. They are useful for creating new fields that don’t exist in the original data source.
Example: BMI Category Column
You can create a new column to classify BMI categories like this :
DAX


Every row now has a stored label (“Overweight” ,“Normal Weight”, "Obesity") that can be used in visuals, filters, or relationships.
Advantages
Calculated columns are useful when you need to create new fields for purposes such as filtering, grouping or establishing relationships between tables. They are ideal for row-level calculations that are required in visuals or when building relationships in the data model. Since the values in calculated columns are precomputed and stored in the dataset, they remain constant and do not change based on user interaction, making them reliable for static categorization and structural logic in your reports.
Disadvantages
Calculated columns are not ideal for performing aggregations or calculations that need to be dynamic, as they are static and do not respond to slicers or filters in your reports. Because calculated columns are physically stored in the data model, they can significantly increase memory usage, especially when working with large datasets. This can lead to slower performance and larger file sizes, making measures a better choice in scenarios where efficiency and interactivity are important.
Iterators in Power BI (SUMX and AVERAGEX)
Iterators are special DAX functions that evaluate expressions row by row in a table, then return a single aggregated result.
You’ll use these in both measures and columns when you want more control over calculations.
SUMX (Measure)
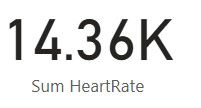
Let’s say you have BP table and column names as Daytime-HR ,Nighttime -HR. You want to calculate total sum of heart rate values where each row in the BP table contributes sum of two columns.
SUMX function goes row by row in the BP table and calculate BP[Daytime-HR] + BP[Nighttime-HR] for each row, then adds up the results across all rows.

AVERAGEX (Measure)
Same logic, but returns the average.


Advantages
Iterator functions like SUMX and AVERAGEX are more flexible than basic functions like SUM() or AVERAGE() because they allow you to define expressions that are evaluated row by row. This makes them ideal for calculations that depend on multiple columns within the same row, such as multiplying quantity by unit price before summing. By enabling row-level logic inside dynamic measures, iterators offer powerful control and precision in your DAX formulas, especially when basic aggregations fall short.
Measure vs Column
Feature | Measure | Calculated Column | Iterators (SUMX,AVERAGEX) |
Calculation Type | Dynamic (on demand) | Static (precomputed) | Dynamic (but row-by-row logic) |
Storage | Not stored on the table | Physically stored in the dataset | Not stored on the table (if used in measures) |
Performance | Optimized, computed when needed | Can slow performance due to storage | Optimized, computed when needed |
Best For | Aggregations, KPIs, and calculations in visuals | Filtering, relationships, and row-level calculations | Calculated measures with custom logic |
When to Use Measures ,Columns and Iterators?
Understanding when to use a Measure or a Column is key to optimizing your Power BI reports.
When to use a Measure
You need calculations that should respond to user selections (e.g., filters, slicers, visuals).
Performing aggregations like SUM, AVERAGE, COUNT, or RATIO calculations.
You want better performance because measures don’t take up storage.
When to use a Calculated Column
You need a new field that can be used for relationships between tables.
You need to filter or group data based on the calculated values.
The calculation does not depend on user interactions (it remains static).
When to use Iterators
You want to combine multiple columns per row (price × quantity)
You need to control calculations across filtered tables
You’re doing custom logic that basic SUM or AVERAGE can't handle
Common Mistakes to Avoid
1. Using a Calculated Column instead of a Measure when performing aggregations.
2.Creating unnecessary columns that increase memory usage without adding value.
3.Not using Measures for dynamic calculations, leading to slow reports.
4.Forgetting to use iterators when calculations depend on multiple columns.
Conclusion
Both Measures and Columns are essential in Power BI, but choosing the right one affects performance and report efficiency.
🔹 Use Measures for calculations that change dynamically.
🔹 Use Columns when you need new fields for filtering or relationships.
🔹 Use Iterators for powerful row-level calculations inside your measures
By understanding when to use each, you can build high-performing Power BI reports that are both efficient and insightful.


