Understanding Tableau Architecture

Tableau is a powerful data visualization tool used across industries to turn raw data into insightful dashboards. But behind its clean and interactive interface lies a robust architecture that supports everything from real-time analytics to large-scale enterprise deployments.
Overview of Tableau key layers
Tableau operates on three key layers that streamline the journey from raw data to insightful dashboards: the Data Layer, Calculation Layer, and Visualization Layer. Let’s dive into each one.
1. Data Layer: Connecting to Your Data
The Data Layer is the foundation of Tableau’s architecture. This is where Tableau connects to a wide range of data sources using built-in connectors. These include:
Relational databases like MySQL, PostgreSQL, and Oracle
Flat files such as Excel and CSV
Cloud data platforms like Google BigQuery, Snowflake, and Amazon Redshift
When connecting to data, Tableau offers two modes:
🔄 Live Connection:Tableau queries the data source in real time. This ensures your dashboards always display the most current data. However, performance is dependent on the speed and reliability of the source.
⚡ Extract Connection:Data is imported into Tableau’s in-memory Hyper engine, allowing faster querying and offline analysis. This is ideal for large datasets or situations where performance is a key concern.
💡 Pro Tip: Use Extracts when performance is critical or data refresh frequency is low.
2. Calculation Layer: Preparing Data for Insights
Once connected, the Calculation Layer empowers users to transform, refine, and analyze their data. Tableau provides a rich set of tools for this, including:
Filters: Basic and advanced filtering to narrow down datasets
Calculated Fields: Derive new metrics using functions and custom formulas
Level of Detail (LOD) Expressions: Control data aggregation at customized levels
Table Calculations: Perform row-level operations like ranking, running totals, and percent differences
These features allow analysts to manipulate data dynamically—without altering the source—making Tableau a flexible platform for exploratory analysis.
3. Visualization Layer: Telling the Data Story
The final step is the Visualization Layer, where data is transformed into interactive charts, maps, and dashboards. Powered by Tableau’s VizQL (Visual Query Language), this layer translates user interactions directly into SQL queries and visual outputs in real time.
Tableau’s drag-and-drop interface makes it easy to:
Build complex visualizations without writing code
Create interactive dashboards with filters, highlights, and actions
Tell compelling data stories that drive decision-making
With seamless interactivity and real-time feedback, users can quickly iterate and uncover insights.
📁 Tableau File Types You Should Know
Understanding file types is essential for effective data management in Tableau:
.twb: Tableau Workbook – contains XML code referencing data sources.
.twbx: Packaged Workbook – includes the data and the workbook.
.tds / .tdsx: Tableau Data Source – reusable data connections.
.hyper: Tableau Extract – highly optimized extract format.
.tde: Legacy extract format (replaced by .hyper).
.tbm: Tableau Bookmark – for sharing specific visualizations.
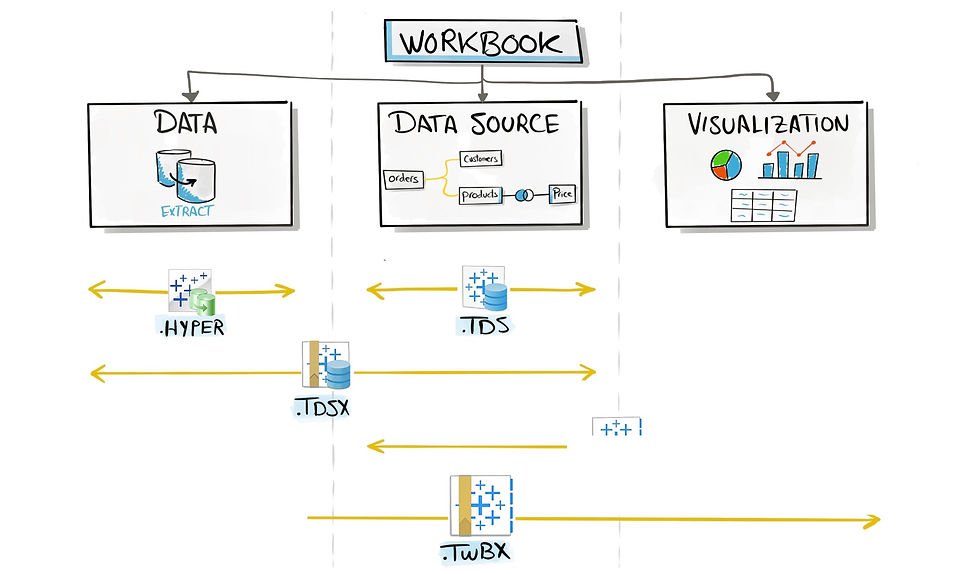
🧰 Tableau Products Explained: From Creator to Consumer
Tableau isn’t just a single application—it’s a suite of products, each designed for different stages and roles in the data analytics workflow.
Product | Description | Target Users |
Tableau Desktop | The primary development environment for building visualizations and dashboards. | Data Analysts, BI Developers |
Tableau Prep Builder | A tool for cleaning, shaping, and combining data visually before analysis. | Data Wranglers, Analysts |
Tableau Server | On-premise solution for publishing, sharing, and managing dashboards securely within organizations. | IT Teams, Enterprises |
Tableau Online | Cloud-hosted version of Tableau Server; offers the same capabilities without server maintenance. | SMBs, Remote Teams |
Tableau Public | Free, cloud-based version for publishing visualizations to the public domain. | Bloggers, Students, Portfolio Builders |
Tableau Mobile | Mobile app for accessing dashboards on the go. | Executives, Field Teams |
Tableau Reader | Free desktop tool to open and view Tableau Packaged Workbooks (.twbx). | Internal Teams (View Only) |
Tableau Data Management Add-On | Adds governance features such as data cataloging, lineage, and quality warnings. | Data Engineers, Governance Teams |
Tableau CRM (formerly Einstein Analytics) | Native Salesforce-integrated analytics powered by AI and machine learning. | Salesforce Users, Data Scientists |
🧭 Choosing the Right Product
Use Tableau Desktop to create dashboards.
Use Tableau Server or Online to publish and share securely.
Use Tableau Prep when your data needs reshaping.
Use Tableau Public when your goal is to showcase your work publicly.
🛂 Tableau Licenses – Types, Access Levels & Use Cases
Tableau offers several types of licenses tailored to different user roles, deployment types, and access needs. Licenses are available for both Tableau Server (on-premise) and Tableau Cloud (formerly Tableau Online).
🧑💻 1. Creator License
💡 For users who need full access to create content and manage data connections.
Feature | Included |
Tableau Desktop | ✅ |
Tableau Prep Builder | ✅ |
Web authoring (Tableau Server/Cloud) | ✅ |
Data connections (live & extracts) | ✅ |
Publish to Server/Cloud | ✅ |
Create dashboards and data models | ✅ |
Typical Users: Data Analysts, BI Developers, Data Engineers
👀 2. Explorer License
💡 For users who explore, edit, and interact with dashboards but don’t create from scratch.
Feature | Included |
Access dashboards on Server/Cloud | ✅ |
Filter, drill down, interact | ✅ |
Create and edit existing dashboards (web only) | ✅ |
No Tableau Desktop | ❌ |
No Tableau Prep | ❌ |
Typical Users: Business Users, Managers, Team Leads
👓 3. Viewer License
💡 For users who only view dashboards and reports.
Feature | Included |
View published dashboards | ✅ |
Subscribe to reports | ✅ |
Interact with filters & tooltips | ✅ |
No editing capabilities | ❌ |
No access to Tableau Desktop or Prep | ❌ |
Typical Users: Executives, Stakeholders, Clients
🖥️ Tableau Desktop Architecture: Behind the Interface
Tableau Desktop is the primary tool for analysts to connect to data, build visualizations, and create dashboards. It simulates a server-like environment locally with the following key components:

🔗 1. Data Sources
Connects to files (Excel, CSV), relational databases (SQL Server, Oracle), and cloud platforms (Google BigQuery, Snowflake, etc.).
Supports both:
Live connections (queries sent directly to the data source)
Extracts using Tableau’s .hyper format stored and queried locally
🧠 2. Core Tableau Desktop Components
Component | Description |
Workbook | File that holds worksheets, dashboards, and data source metadata (.twb, .twbx) |
Data Connectors | Drivers and interfaces that connect Tableau to different data types |
Data Engine (Hyper) | Executes queries on extracts locally for fast performance |
VizQL Engine | Translates user actions into SQL and then into rendered visualizations |
Metadata Layer | Maintains field types, joins, filters, calculations, and hierarchies |
Repository (Local) | Folder in your file system (My Tableau Repository) storing logs, bookmarks, saved data sources, etc. |
👁️ 3. Consumer Role in Tableau Desktop
The user (analyst or developer) is both the author and consumer.
They interact with Tableau Desktop to:
Connect to data
Clean and model data
Build worksheets and dashboards
Save and publish workbooks to Tableau Server or Tableau Public
🚀 Publishing to Tableau Server: How it Works
Once dashboards are built in Tableau Desktop, the next step is sharing them with others through Tableau Server or Tableau Online. This is done through a secure and structured publish process that ensures your data and visualizations are available to the right audience.
Initiating the Publish The user clicks “Publish” from Tableau Desktop. Tableau packages the workbook, including data, visualizations, and initial permission settings.
File Transfer and Deployment The packaged workbook is transferred to Tableau Server or Tableau Online, where it is unpacked. Metadata is stored in the server's PostgreSQL repository.
Server-Side Configuration On the server, administrators or users with the necessary permissions can:
Register and manage data sources
Set permissions and access control to define who can view or edit the dashboard
Configure extract refresh schedules (if applicable)
Content and Access Management Server admins can manage published content, monitor performance, schedule data refreshes, and ensure appropriate access across teams or departments.
The publish process in Tableau is designed to be seamless for developers and secure for organizations. By properly managing permissions, projects, and data sources, teams can collaborate efficiently while ensuring governance.
🔐 Authentication & Access Control
Security is at the heart of any enterprise BI tool, and Tableau ensures protected access to data through a robust authentication process. Before users can view or interact with dashboards, Tableau Server verifies who they are and what they’re allowed to do.
Authentication: Supports Active Directory, SAML, OpenID, and more.
Authorization: Role-based permissions to restrict access at the workbook, project, or data source level.
Viz Access Flow: Once authenticated, the user requests are routed through the VizQL Server to render the dashboard view.
🌐 Tableau Server Architecture
Tableau Server enables secure, scalable sharing and collaboration on dashboards across an organization. It is designed for enterprise deployment with robust backend components to support performance, user access, and data governance.
🔗 1. Data Sources
Functions similarly to Tableau Desktop.
Connects to:
Databases (e.g., SQL Server, Oracle)
Files (e.g., Excel, CSV)
Cloud data warehouses (e.g., Snowflake, Google BigQuery)
Supports:
Live Connections – Real-time queries
Extracts – Local snapshot of data
🏗️ 2. Key Server Components
When dashboards are published to Tableau Server, they are handled by specialized backend services. Each component plays a crucial role in overall system performance, scalability, and user interaction.
1️⃣ Data Connectors
Role: Connect Tableau to external data sources.
Supports both Live and Extract connections.
Ensures secure and scalable access using JDBC/ODBC or native connectors.
2️⃣ Repository (PostgreSQL Database)
Also Known As: Repo or PGSQL repository.
Role: Stores metadata, tracks user activity, and logs.
Maintains data such as:
Published content
User roles and permissions
Scheduled tasks (e.g., refreshes)
Server activity logs
Useful for governance and administration.
3️⃣ VizQL Server
Role: Converts user interactions into queries and renders visualizations.
Translates dashboard actions into SQL/MDX.
Sends queries to the Data Engine or data source and renders results.
Critical for interactive performance and visual responsiveness.
4️⃣ Cache Server
Role: Stores reusable query results to boost performance.
Prevents redundant querying for:
Frequently accessed dashboards
Shared views and filters
Reduces server load and accelerates response times.
5️⃣ Backgrounder
Role: Manages scheduled and background tasks.
Handles:
Extract refreshes
Email subscriptions
Alert triggers
Can be scaled horizontally for large workloads.
6️⃣ Data Engine (Hyper)
Role: Executes high-speed queries on data extracts (.hyper files).
Tableau’s in-memory analytics engine.
Provides:
Fast query processing
Data compression
Used when:
Workbooks rely on extracts
Publishing data extracts to the server
7️⃣ Data Server
Role: Manages shared data sources and metadata centrally.
Allows reuse of:
Extracts
Calculated fields
Hierarchies, groups, and metadata
Ensures data consistency and governance across dashboards.
8️⃣ File Store
Role: Stores physical files including:
Data extracts
Workbooks
Temporary files
Shared across nodes using NFS in multi-node environments.
Accessed by Backgrounder and Data Engine.
9️⃣ Application Server (VizPortal)
Role: Manages user interface and access control.
Handles:
Login/authentication (SAML, Active Directory, OAuth)
User sessions and timeouts
Browsing and permissions
Hosts the browser-based Tableau Server UI.
🌐 3. Gateway
Role: Acts as a reverse proxy and load balancer.
Routes user requests to the appropriate internal service.
👥 4. Consumer
End users who interact with dashboards via:
Web browser (Tableau Server or Tableau Online)
Tableau Desktop
Static reports or subscribed emails

🌐 Tableau Public Architecture
For individual users or bloggers, Tableau Public offers a free cloud platform to publish dashboards. Unlike Tableau Server or Online, Tableau Public is public by nature—meaning anyone can view your dashboards unless they're hidden.
🧭 Final Thoughts
Whether you're a solo analyst or part of an enterprise analytics team, understanding Tableau’s architecture empowers you to make the right decisions for performance, scalability, and security.
Reference:


