Understanding Row Context and Filter Context in Power BI: A DAX Perspective

Introduction
In data analysis, Power BI is one of the most powerful data visualization and user-friendly reporting tools. Data Analysis Expressions (DAX) is a formula language designed to handle calculations, aggregations, and data transformations. However, to truly unlock the potential of DAX, understanding Row Context and Filter Context is essential.
These two concepts govern how our DAX formulas are evaluated and determine the accuracy of our calculations. Whether we are creating measures, calculated columns, or working with complex relationships, knowing how Row Context and Filter Context work together can make or break your analysis.
In this blog, we will explore both Row Context and Filter Context, understand how they work, and learn how to apply them effectively in our Power BI models.
What is Row Context?
Row Context refers to the environment in which DAX expressions are evaluated row by row. It’s often seen when working with calculated columns or iterating over tables.
When a DAX formula evaluates a row in a table, it operates within that specific row's context. This means that values from the current row are used in calculations.
Row context can be used in calculated columns. Let's see how we can create a calculated column using row context.
First, load the Superstore Sales data into Power BI. Then, create a calculated column for "Profit per Quantity" by dividing 'Sales Data'[Profit] by 'Sales Data'[Quantity]. This will create a new column because a calculated column operates in a row context. It automatically processes one row at a time, scanning the table and providing the output. It starts with the first row, performs the calculation, and then moves on to the second row, continuing in this way through the entire table in an iterative process.

In the Report View, select the Category, Segment, and Sum of Profit per Quantity columns for display in a table visualization.
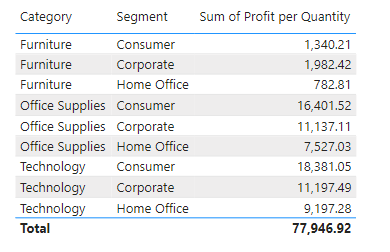
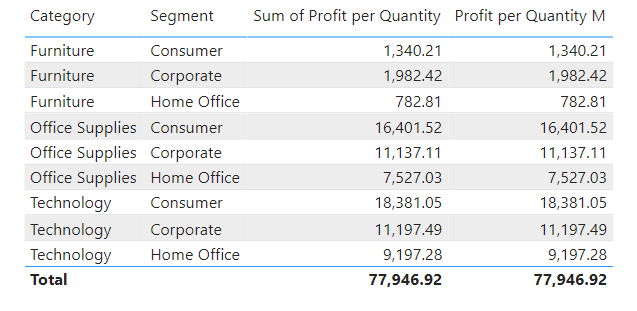
A measure does not have a Row Context. However, to create a measure, we need to use aggregate functions. In this case, we can create a measure called "Profit per Quantity M" and replicate the same calculation as we did in the calculated column earlier. To achieve this, we can use an iterative function like SUMX, which is ideal for this example as it scans the table one row at a time.

In the Report View, compare the calculated column 'Sum of Profit per Quantity' and the measure 'Profit per Quantity M' alongside the Category and Segment columns in a table visualization. Both will display the same values for each row in the table.
What is Filter Context?
Filter Context refers to the active set of filters that restrict the dataset being evaluated by a DAX expression. Filter Context can be modified through Slicers, the Filter pane, DAX functions, and Table relationships.
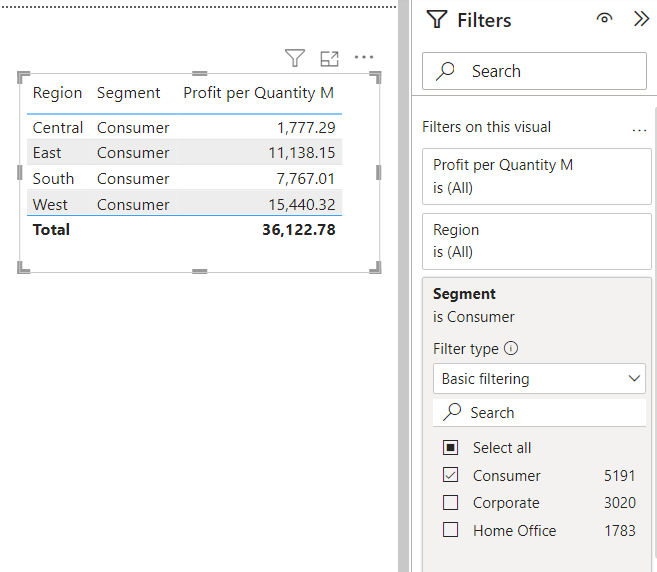
To better understand how Filter Context works in Power BI, let’s start by examining a basic table or grid. In this example, create a simple table that includes the Region, Segment, and Profit per Quantity M columns.
When loading the table, notice that the values are automatically filtered by Power BI. By default, the data displayed will only include entries for the Central, East, South, and West regions. This happens because Power BI applies a Filter Context to the table, meaning it restricts the data to these regions as a part of its automatic filtering process.

By adjusting the Filter Context, we can control which data is considered in our calculations and visualizations.
Let’s walk through an example of how to modify the Filter Context by applying filters directly in Power BI.
Step 1: Apply a Filter to the Segment Column
In this case, we will focus on the Segment column. To change the Filter Context, apply a filter to the Segment column and select only the Consumer segment.
Step 2: Observe the Results
Once the filter is applied, Power BI will automatically update the table, showing only the data related to the Consumer segment. All other segments (like Corporate or Home Office) will be excluded from the calculations. This means that the filter completely removes or ignores the other segments from the results, allowing us to focus solely on the Consumer segment data.
Creating a Custom DAX Measure and Comparing It with a Table Visualization
Now that we have a basic understanding of how Filter Context works in Power BI, let’s dive into creating a custom DAX measure and comparing it with a table visualization.
Step 1: Create the Custom DAX Measure
To create this custom measure, we will use the CALCULATE function in DAX. The CALCULATE function allows to modify the filter context and apply specific conditions to our calculations.
Here’s the DAX formula for custom measure:
Consumer_Measure = CALCULATE(
SUM('Sales Data'[Profit per Quantity]),
'Sales Data'[Region] = "West",
'Sales Data'[Segment] = "Consumer"
)
SUM ('Sales Data'[Profit per Quantity]): This part calculates the sum of the Profit per Quantity column.
'Sales Data'[Region] = "West": This condition filters the data to include only rows where the Region is "West".
'Sales Data'[Segment] = "Consumer": This condition further filters the data to include only rows where the Segment is "Consumer".
The CALCULATE function applies both filters to the sum calculation, so the result will be the total Profit per Quantity for the Consumer segment in the West region.

Step 2: Add Measure to the Report
After creating the measure, add it to the report. For example, display it in a Card visualization to show the total Profit per Quantity for the Consumer segment in the West region, or include it in a Table visualization to compare it across different regions and segments.

Filter Context in Table Relationships: Creating and Loading a New Table
In Power BI, Filter Context can also be influenced by Table Relationships.
Step 1: Create a New Table for Region Data
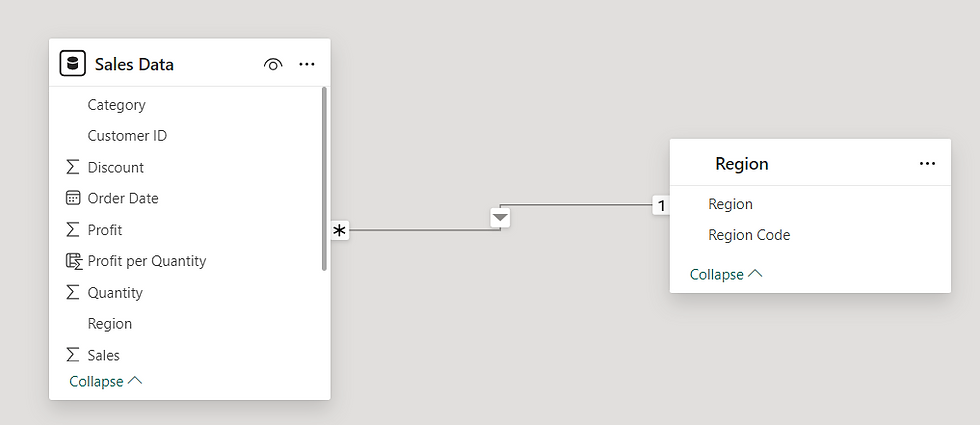
To begin, create and load a new table called ‘Region’ that contains two columns: Region and Region Code. This table will help to establish a relationship with the other table in our model, such as a Sales Data table, which may include a Region column.
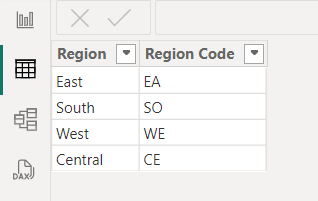
In the Model view, create a relationship between the two tables by linking the Region column in the ‘Region’ table with the Region column in the Sales Data table.
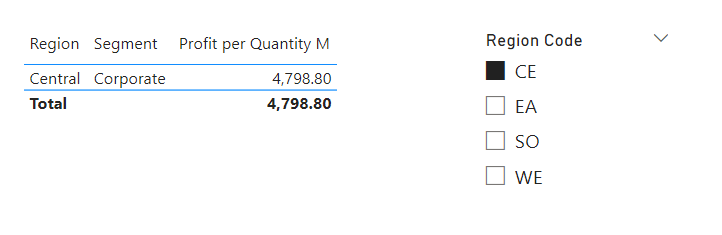
In Report view, if the Region Code column from the Region table is used as a slicer and the region code CE is selected, the values for the Central region will be applied in the Filter Context.
Removing Filter Context: Bypassing Existing Filters with a Measure
In Power BI, sometimes we may want to create a measure that bypasses any existing filter context applied to the data. This can be useful when we need to calculate a value based on the entire dataset, regardless of any filters that may have been set through slicers, visuals, or other elements.
To achieve this, create a new measure that removes or ignores the current filter context. One of the most common functions used for this purpose is the ALL () function in DAX, which removes filters from the specified column or table.
Example Measure to Bypass Filter Context
Let’s create a measure called Filter Removal that calculates the Profit per Quantity and ignores any filters applied to the Sales Data table.
SUM ('Sales Data'[Profit per Quantity]): This part calculates the sum of the Profit per Quantity column from the Sales Data table.
ALL ('Sales Data'): This removes all filters that may have been applied to the Sales Data table. The ALL () function ensures that the calculation considers the entire dataset, ignoring any filters, whether they come from slicers, visuals, or other sources.
The Filter Removal measure gives the total Profit per Quantity across all data in the Sales Data table, irrespective of any filters or slicers that might be active in the report. This is useful when we want to show overall totals or compare them to filtered values.

Conclusion: Mastering Row and Filter Context in DAX
To create efficient DAX formulas, having a strong understanding of Row Context and Filter Context is essential. These two principles shape how our formulas behave and how data is evaluated in Power BI. Keep these best practices in mind as you work with DAX:
Always consider the current context when writing formulas to ensure they behave as expected.
Use CALCULATE to modify the filter context deliberately, allowing to refine and adjust calculations.
Leverage context transition for row-by-row calculations when working with calculated columns or measures.
Be mindful of the differences between measures and calculated columns, as they each operate in different contexts and affect results in unique ways.
By following these best practices, we will be well-equipped to create powerful and efficient DAX formulas that fully leverage both row and filter context.


