Transforming Poor-Quality Data into High-Quality Data Using Practical Data Cleaning Techniques in Python

Introduction
In real-world projects, data is rarely clean and ready for analysis. In this blog, I use a sales dataset that contains common data quality issues such as missing values, duplicate records, inconsistent column names, and incorrect data formats. These issues often occur because sales data comes from multiple sources or manual entry. Cleaning the data is essential before performing accurate analysis or generating reliable insights.
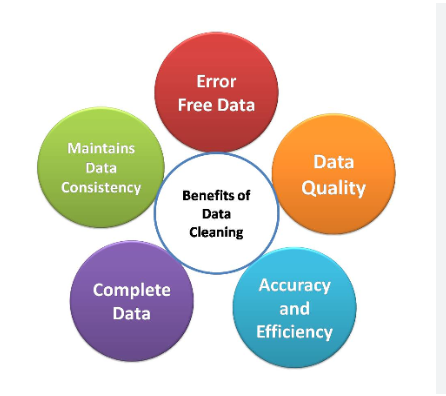
In this blog, we will learn how to transform poor-quality data into high-quality data using practical data cleaning techniques in Python. Poor-quality data often contains missing values, duplicates, incorrect formats, and inconsistent entries, which can lead to wrong or misleading analysis results. Using simple Python tools, we will identify these common data problems and fix them step by step. Each cleaning technique is explained in an easy and practical way. The goal is to make the data clean, consistent, and reliable. Clean data reduces errors and improves the accuracy of analysis. By the end of this blog, the dataset will be ready for analysis and better decision-making.
If you would like a deeper understanding of why data quality is important before analysis, you can refer to my earlier blog: Good Data vs Poor Data: Why Data Quality Matters in Analytics.
Dataset Overview
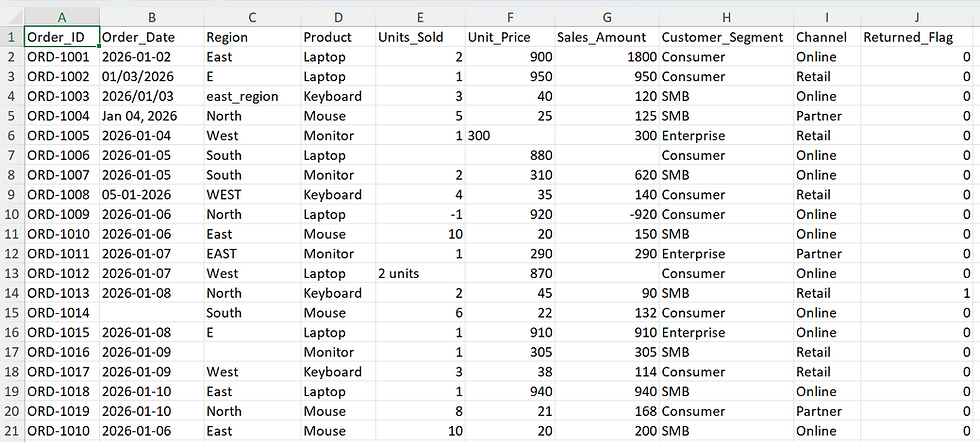
The sales dataset used in this blog is a practice dataset designed to simulate real-world data challenges. It contains multiple rows and columns representing typical sales-related information, such as order details, customer data, product information, sales amounts, and dates. Each row represents a sales record, while the columns capture key business attributes that are commonly used for reporting and analysis.
During the initial review of the dataset, several data quality issues were observed, including missing values, inconsistent text formats, duplicate records, and incorrect data types where numeric values were stored as text. These issues reflect common problems found in real business datasets and make the dataset suitable for demonstrating practical data cleaning techniques using Python.
Practical Data Cleaning Techniques Using Python
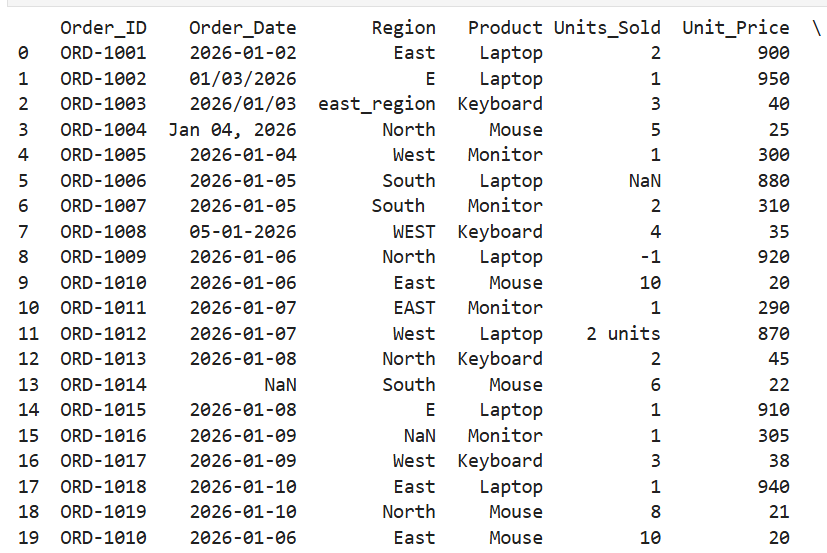
Step1: Importing all necessary libraries and dataset

Output:
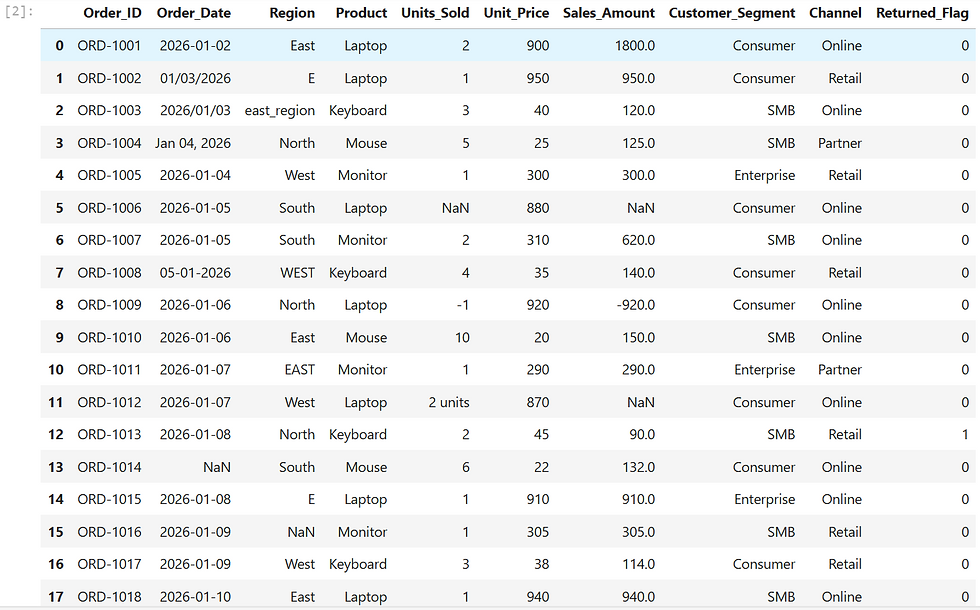
Step2: Copying a Data Frame

Output:
Step3:
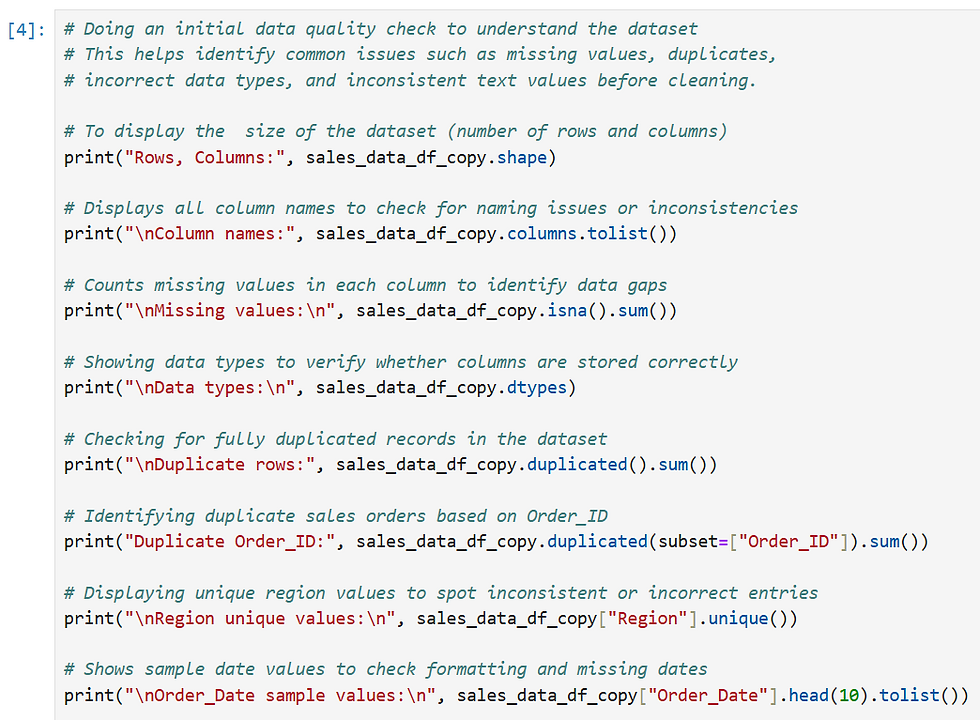
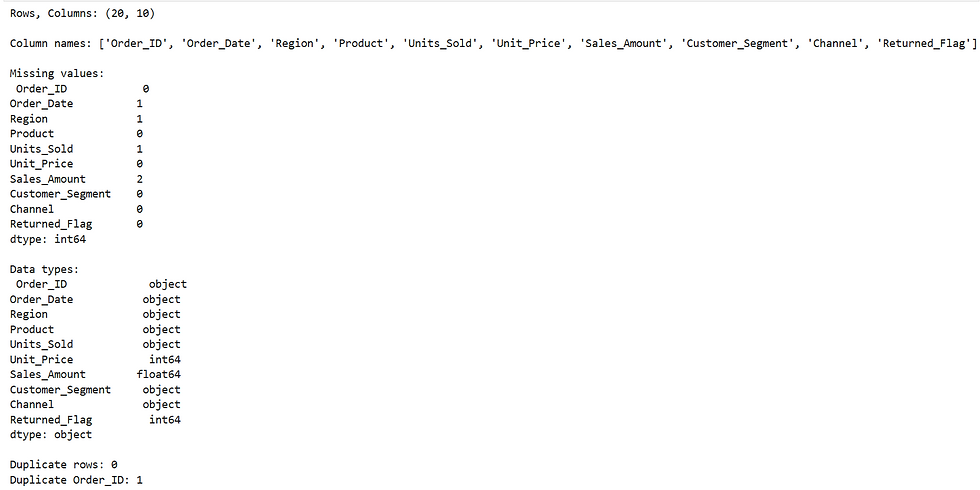
Cleaning step: An initial data quality check is performing to review the dataset structure, missing values, duplicates, and data types. This helps identify what needs to be cleaned before further analysis.
Output:

Step4:
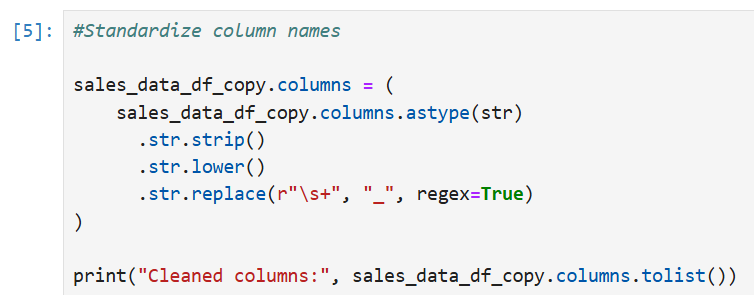
Cleaning Step: Column names are standardized by removing extra spaces, converting them to lowercase, and replacing spaces with underscores. This makes the column names consistent and easier to use in Python code without errors.
Output:

Step5:
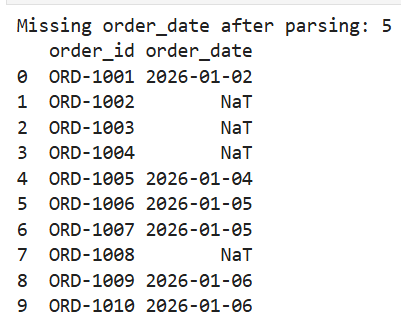
The order_date column is converted into a proper date format to handle different date styles consistently. This allows the data to be sorted, filtered, and analyzed correctly while also identifying missing or invalid dates.

Output:
NaT means “Not a Time.”
In Python (pandas), NaT is used for missing or invalid date/time values, similar to how NaN is used for missing numbers.
Step6:
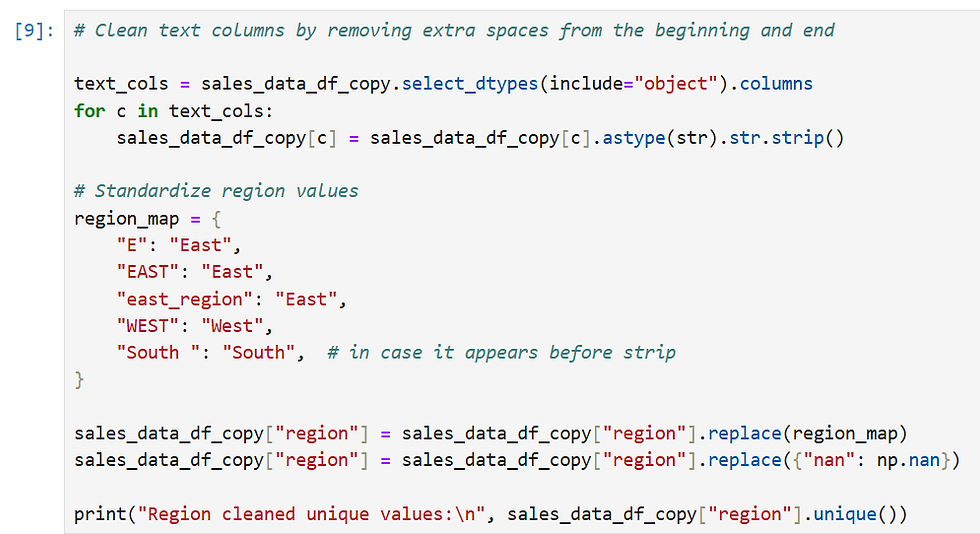
Text columns are cleaned by removing extra spaces to ensure consistent values. Region names are then standardized by mapping different variations to a single, clear format, making the data easier to group and analyze.
Output:

Step7:
Numeric columns that were stored as text are converted into proper numeric values. This ensures calculations such as totals, averages, and sales amounts work correctly and also helps identify any missing or invalid numbers.

Output:

Step8:
Duplicate sales records are removed using the order_id so that each order is counted only once. This prevents double-counting and ensures accurate sales analysis.

Output:

Step9:
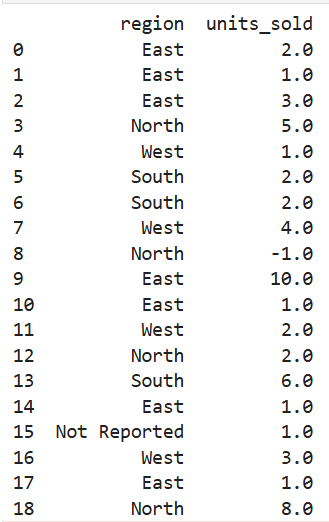
Missing region values are filled with “NR” (Not Reported) to keep all records. Missing values in units_sold are filled using the median to maintain reasonable numeric consistency without affecting overall trends.

Output:
Step10:
The sales amount is validated by recalculating it using units_sold and unit_price. If the original sales amount is missing or incorrect, it is replaced with the correct calculated value to ensure accurate sales data.

Output:

Step11:
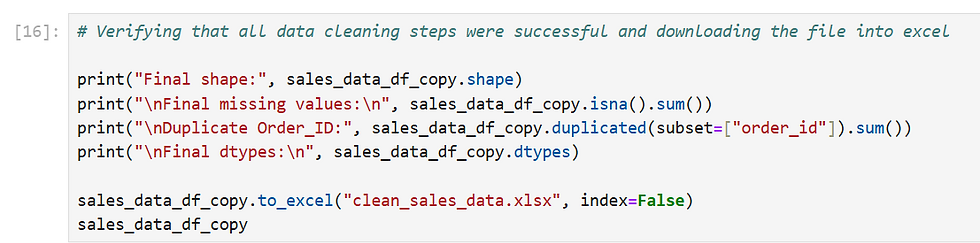
Final validation checks are performed to confirm that all cleaning steps were successful by reviewing the dataset shape, missing values, duplicates, and data types. The cleaned sales data is then saved to an Excel file for further analysis.
Output:

The below table is the final cleaning data
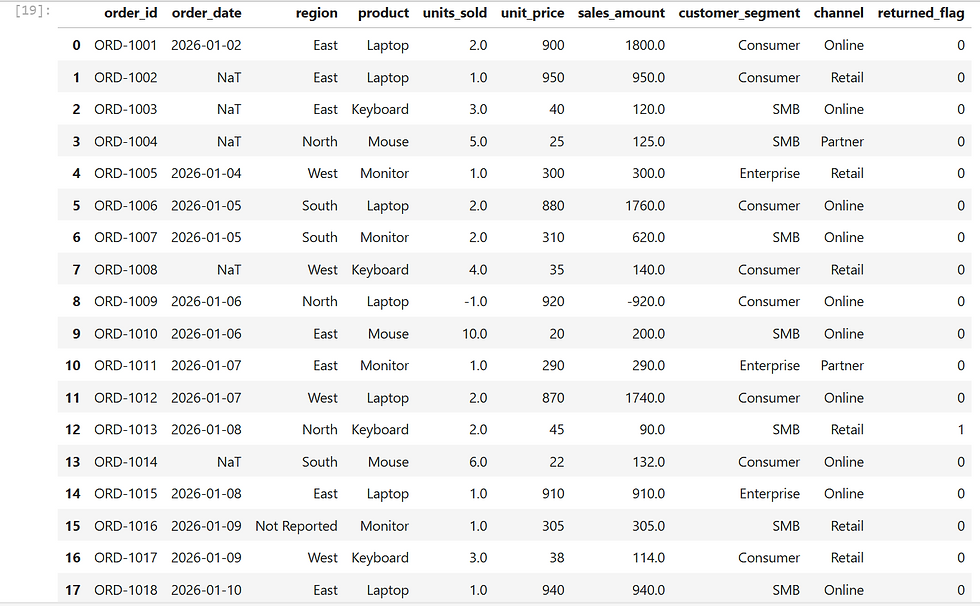
Before deleting NR and NaT values, it is important to understand why the data is missing and whether the affected column is critical for analysis. In cases where missing values appear in important fields, removing those rows may be necessary to ensure accurate results. However, deleting too many records can reduce the overall size and quality of the dataset. Therefore, decisions to delete NaN or NaT values should always be based on the analysis goals and the business context.
In the final cleaned dataset, some NR and NaT values are kept because removing these records could lead to unnecessary data loss. Keeping the missing values helps preserve important information in other columns. This approach avoids making assumptions or guessing missing data. As a result, the dataset remains reliable and suitable for analysis.
In the next blog, I will use this cleaned dataset to perform descriptive analysis and gain a clearer understanding of sales trends and patterns.


