The Ultimate Guide to Tableau LOD Expressions(FIXED, INCLUDE, EXCLUDE )

Have you ever created a calculation in Tableau that looked perfect until you add filter or changed the dimension in your view? The moment we add a filter or change the dimension the calculation suddenly gives different result which confuses the beginners thinking formula is wrong. But this happens becauseTableau recalculates everything based on the level of detail in the view . That’s where LOD Expressions help.
What are LOD Expressions?
LOD Expressions in Tableau allow you to perform calculations that are independent of the dimensions and filters in a visualization. They help you specify the level of granularity for a calculation.
LOD Expressions helps you control values, no matter what filters or dimensions are in the view. They allow to fix the level of aggregation so that results may stay consistent even when the visualization changes. One of the biggest advantage of LOD is they separate calculation logic from visual layout. For Example you can calculate the average sales per customer at customer level, even if your view is showing the data at region or month level , this type of calculation is difficult using only table calculation.
Types of LOD Expressions
1 FIXED
2 INCLUDE
3 EXCLUDE
FIXED LOD-Used to define the specific level of detail regardless of view, ensuring calculations stay constant.
Syntax:
{FIXED [Dimension]: AGG([Measure])}Example: Total Sales per Category
{FIXED [Category]: SUM([Sales])}This tells Tableau ignore the City, Region, store breakdown and always calculate SUM of Sales at Category level.
Use Case:
Category totals should remain constant even when filtering by City or Region or Store.
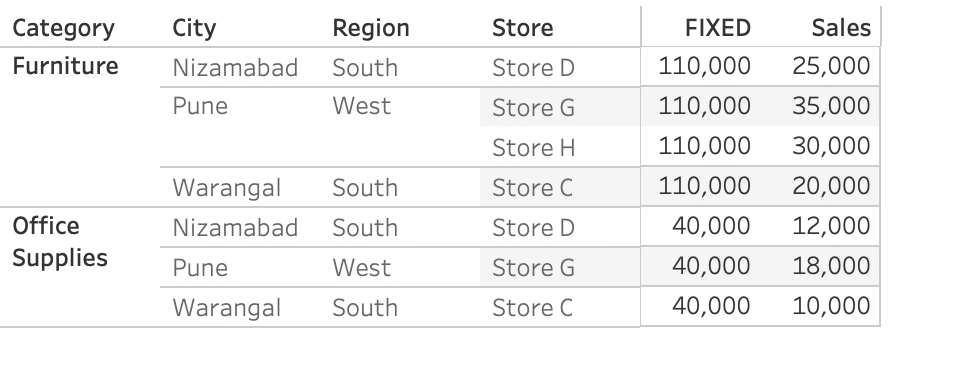
This table compares actual store-level sales with FIXED LOD totals per Category. Notice how the FIXED value stays constant for each Category, while Sales varies by Store. This shows that FIXED calculates at Category level ignoring view granularity.

This stacked bar chart shows how each store contributes to category sales. The FIXED value acts as reference total repeated across rows while the colored blocks shows the variation in Furniture and Office Supplies sales.
Note: FIXED LOD respects context filters but ignores view Filters.
INCLUDE LOD- It adds extra detail to your calculation by including lower level dimensions , even if that dimension is not in the view.
Syntax:
{INCLUDE [Lower Level Dimension]: AGG([Measure]) }Example:
{INCLUDE [Store]: AVG([SALES]) }Use Case: The Table shows the sales data for different stores in cities . It includes details like Region, City, Store, Category and Sales amount. We want the average sales as per store even if the store is not in the view.

The Table shows how average sales vary by city and category. The ‘Avg. Include ‘ column reflects values calculated using INCLUDE logic which considered additional dimension ‘Store’.

This Chart shows city-level Averages but the INCLUDE LOD pulls in store-level averages behind the scenes and then rolls them up to city level, letting us compare cities based on true store performance.
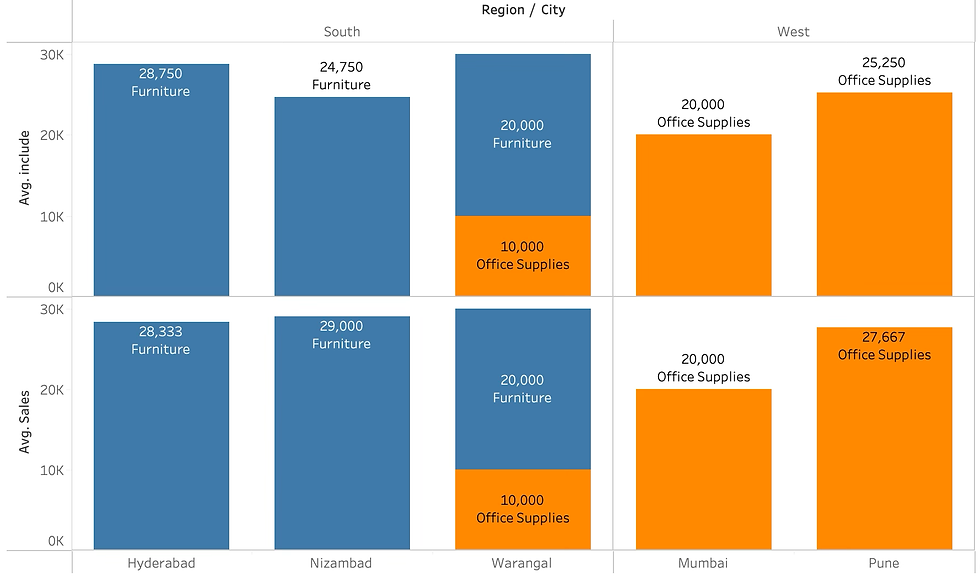
INCLUDE LOD expressions calculate at more detailed level first like Store ad then aggregate those results to match the current view level such as City.
Avg. Include Calculation
Example Suppose Hyderabad has two stores
Store A
Store B
Average of Store A is 40000+15000 =27500
2
Average of Store B is 30000
Now Tableau Average this Store level Averages
27500+30000 = 28750 ( Avg.Include value for Hyderabad Furniture)
2
Regular AVG(Sales)
The Tableau averages all rows for Hyderabad-Furniture not store level aggregates.
So if Store A has 2 rows and Store B has 1 row the regular average would be
40000+15000+30000
3 =28333 which differs from INCLUDE since it respects store level granularity first .
EXCLUDE LOD-It removes the dimensions from the view’s level of detail before performing the calculation even if it’s shown in the view.
Syntax:
{ EXCLUDE[Dimension]: AGG[Measure]) }Example:
{ EXCLUDE[Category]: SUM[Sales]) }Use Case:The view shows Category level rows, but we want to calculate total sales at Store level ignoring Category.
View:
Region->City->Store->Category
Goal:
Store level Sales
Solution:
Use EXCLUDE to remove Category from the calculation.
Table Results for Total Sales Vs EXCLUDE Store wise sales.

EXCLUDE removes Category from the calculation so even though the view shows Category level rows . The EXCLUDE value stays the same for all the Categories within the same City and Store.

This Stacked bar chart shows sales split by category across stores. Even though Category is in the view EXCLUDE LOD forces to calculate sales at the store level giving a clean total per store.
Conclusion:
LOD give you full control over how Tableau calculates data.
FIXED-Calculates at specific level, no matter what’s in the view
INCLUDE-Adds lower-level detail in the calculation even if it’s not in the view.
EXCLUDE-Removes a dimension from the view to calculate at higher level.
By using FIXED, INCLUDE, EXCLUDE you can shape calculations at exactly the level of your analysis needs.


