The 360-Degree Heart Audit: A SQL Investigation into Silent Cardiac Risk

The Mystery: The "Asymptomatic" Paradox
In this blog we are trying to uncover the fact how the data looks could be deceptive .In clinical diagnostics, we are taught to respect the "Symptom Hierarchy." We expect Typical Angina—the classic, crushing chest pain—to be the ultimate red flag that a patient is in danger. It is the signal that triggers immediate action in every Emergency Room in the world.
But what happens when the most dangerous patients are the ones who feel absolutely nothing?
By treating the Heart Disease UCI Dataset as our digital laboratory, we are moving beyond simple data entry. We are going to use PostgreSQL to uncover the "Asymptomatic Trap"—a phenomenon where the absence of pain masks the presence of severe cardiac compromise.
The Analytical Journey: Peeling Back the Layers
This isn't just a blog on SQL syntax; it is a clinical detective story. To unravel the facts, we must peel back the heart's physiology in three distinct phases:
Phase 1: The Symptom Layer – We start by challenging our assumptions about chest pain and disease prevalence.
Phase 2: The Physiological Layer – We move into the "Physics of Failure," using SQL math to calculate the heart's mechanical efficiency and stress index.
Phase 3: The Predictive Layer – We conclude by building a "Metabolic Scoring Engine," a multi-marker risk tool that identifies high-priority outliers before they become statistics.
By the end of this audit, you will see how a database can be transformed from a passive storage unit into a proactive screening tool. We aren't just querying rows; we are identifying the "Perfect Storm" of silent risks.
DISCREPNICIES IN DATA:
Before we dive into the high-level analysis, we must address the "Clinical Noise" we discovered during our initial inspection. In the raw heart.csv, zeros are often used as placeholders for missing data (especially in Cholesterol and Blood Pressure).
If you leave these as 0, your AVG () and CORR() functions will be mathematically incorrect. Here is the SQL cleaning script to prepare your library for the 360-Degree Audit.
So in order to do that we run the below sql queries which takes care of the discrepancies in the data

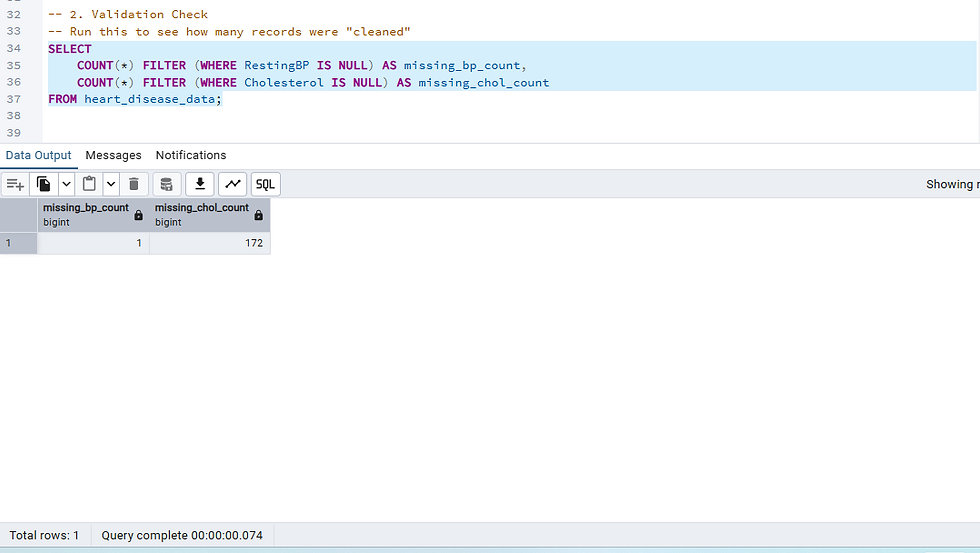
LET US UNDERSTAND FIRST WHY ARE WE DOING THIS :
· The heart.csv data set has 172 records with 0 cholesterol. A human knows that a person cannot have 0 cholesterol, but the computer doesn’t so we need to take care of it.
· If you calculate the average cholesterol with those zeros, the result is 198 mg/dl. Once you "clean" the data by setting them to NULL, the real clinical average jumps to 244 mg/dl.
· In PostgreSQL, functions like AVG(), MIN(), and MAX() are designed to automatically skip NULL values, ensuring your clinical baselines are 100% accurate.
Now that our data is clean and ready let us proceed for further analysis
Phase 1: The Symptom Layer (The Asymptomatic Paradox)
In the world of cardiology, we are trained to look for Typical Angina(TA)—the classic chest pain associated with heart attacks. But when we look at the data, we see a "Symptom Gap" that suggests the heart is often a silent actor.
Query 1: The Prevalence Shock
The first step in our audit is to measure the actual disease prevalence across all chest pain categories. We use a simple SQL aggregation to find the percentage of patients diagnosed with heart disease.

Finding:
Typical Angina (TA) -43.48%
Asymptomatic (ASY)- 79.03%
Insight:
In this dataset, "No Pain" is the single most dangerous symptom. This is the Asymptomatic Trap. patients who feel no distress often have the most advanced cardiovascular compromise.
Query 2: The "Stress Test" Validation
Is it possible that these ASY patients only show signs of trouble under physical stress? We can validate this by cross-referencing their pain type with Exercise-Induced Angina.
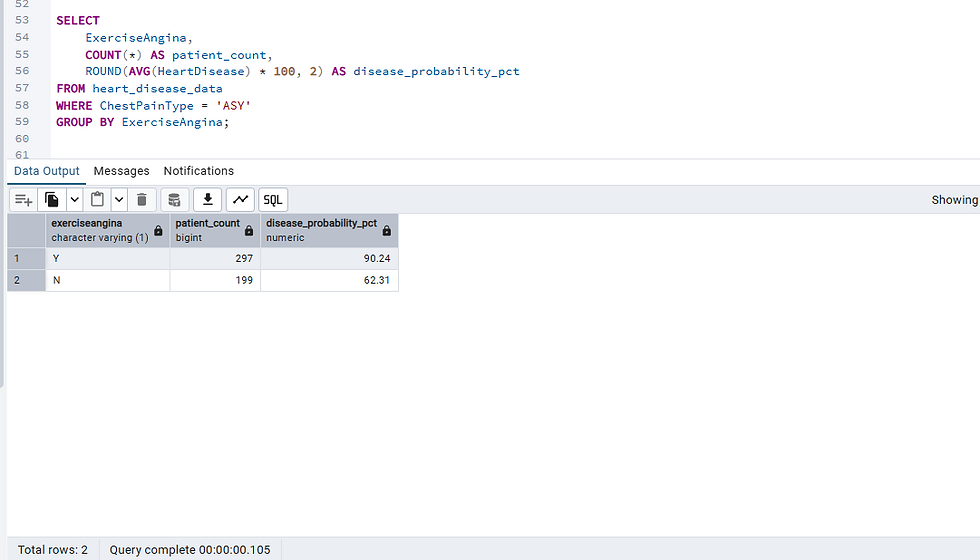
Finding:
For ASY patients who also experience Exercise Angina, the probability of heart disease jumps to 90.2%. However, even for those who don't feel pain during exercise, the disease rate remains high at 62.3%.\
Insight:
"Silence" in clinical data is a mask. By using SQL to layer these symptoms, we prove that ASY patients are not a "low-risk" group—they are a high-risk group whose symptoms have simply become silent due to the severity of their condition.
Phase 2: The Physiological Layer (The Physics of Failure)
If a patient in the "ASY" group says they feel fine, we don't just take their word for it. We look at physics. A diseased heart often loses its "Cardiac Reserve”-the ability to increase its output under stress. In this phase, we use SQL to quantify this mechanical struggle.
Query 3: The Cardiac Efficiency Gap
In cardiology, a common rule of thumb for Maximum Heart Rate is (220 -age). By comparing a patient's actual MaxHR to this predicted limit, we can calculate their Cardiac Efficiency Score.
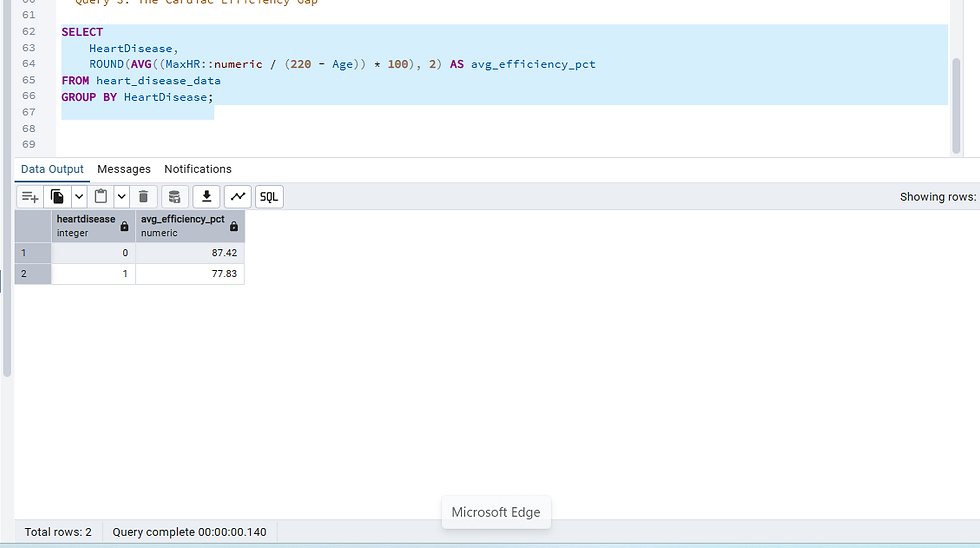
Finding:
· Healthy Patients: Average 87.4% efficiency.
Heart Disease Patients: Average 77.8% efficiency.
Insight:
There is a nearly 10% Efficiency Gap. Patients with heart disease hit a "physiological ceiling" much earlier. Their hearts simply cannot pump fast enough to meet the demands of the body, even if they aren't reporting pain yet.
Query 4: The "Stress Index" (BP to HR Ratio)
Another way to measure failure is the relationship between Pressure and Output. A healthy heart pumps efficiently at lower pressures. A struggling heart requires higher blood pressure to achieve a lower heart rate.
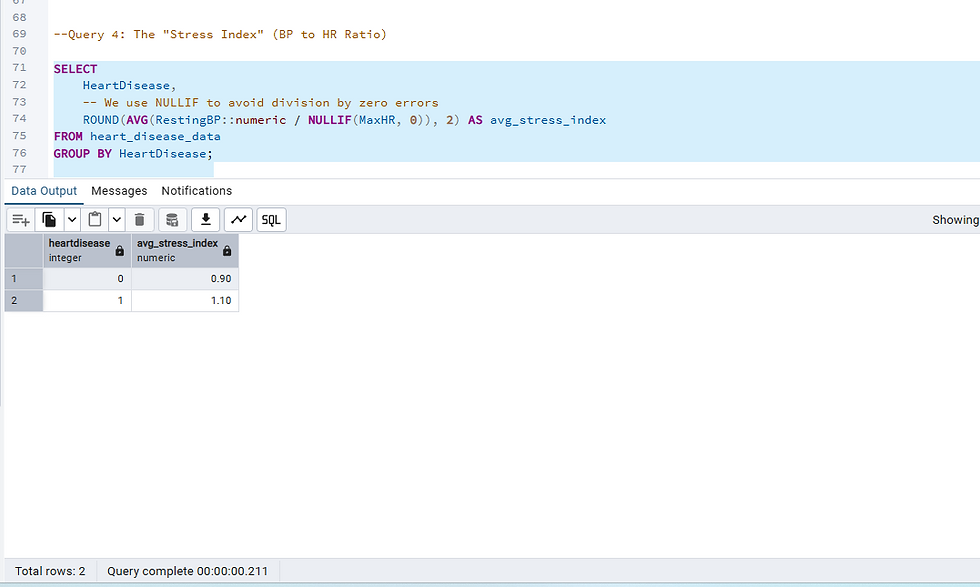
Finding:
Healthy Group: Stress Index of 0.90.
Disease Group: Stress Index of 1.10.
Insight:
A higher Stress Index is a sign of mechanical inefficiency. The diseased heart is working harder (higher Pressure) to do less work (lower Heart Rate). By calculating this ratio, we turn two standard vital signs into a powerful diagnostic marker.
Phase 3: The Predictive Layer (The Metabolic Scoring Engine)
So far, we have looked at symptoms and physics. Now, we will use PostgreSQL to build a Metabolic Risk Index. We will assign a point for every clinical threshold a patient crosses, creating a 0-to-4 scale that quantifies their "Metabolic Burden."
Query 5: Building the Risk Score
We define our risk points based on four high-impact clinical markers:
Age (> 55): Increased vascular wear.
Blood Pressure (> 140): Hypertension.
Fasting Blood Sugar (= 1): Diabetic risk.
Cholesterol (> 240): Hyperlipidemia (using our cleaned data).
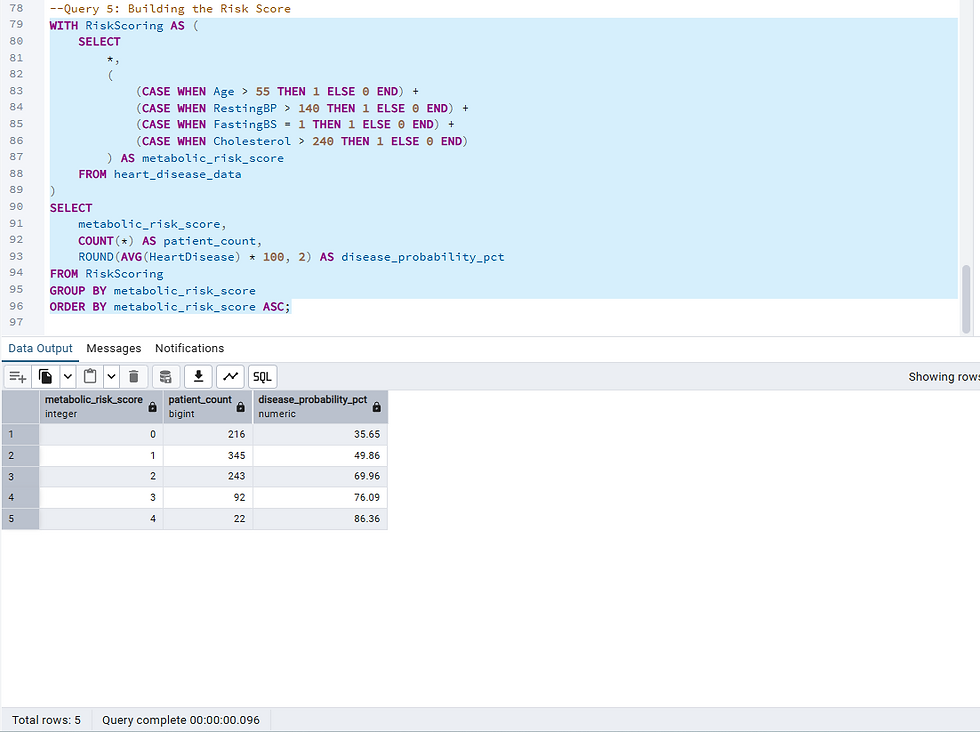
Finding:
· Risk Score 0: 35.6% Disease Probability.
Risk Score 4: 86.4% Disease Probability.
Insight:
Risk isn't a binary; it’s a spectrum. By using a CTE (Common Table Expression), we turned our static table into a dynamic scoring engine that shows as the "Metabolic Burden" increases, the likelihood of disease more than doubles.
Query 6: Identifying the "High-Priority" Outliers
Finally, we combine everything. We want to find the "Perfect Storm" patients: those who are Asymptomatic (Phase 1), have Low Efficiency (Phase 2), and a High Risk Score (Phase 3).
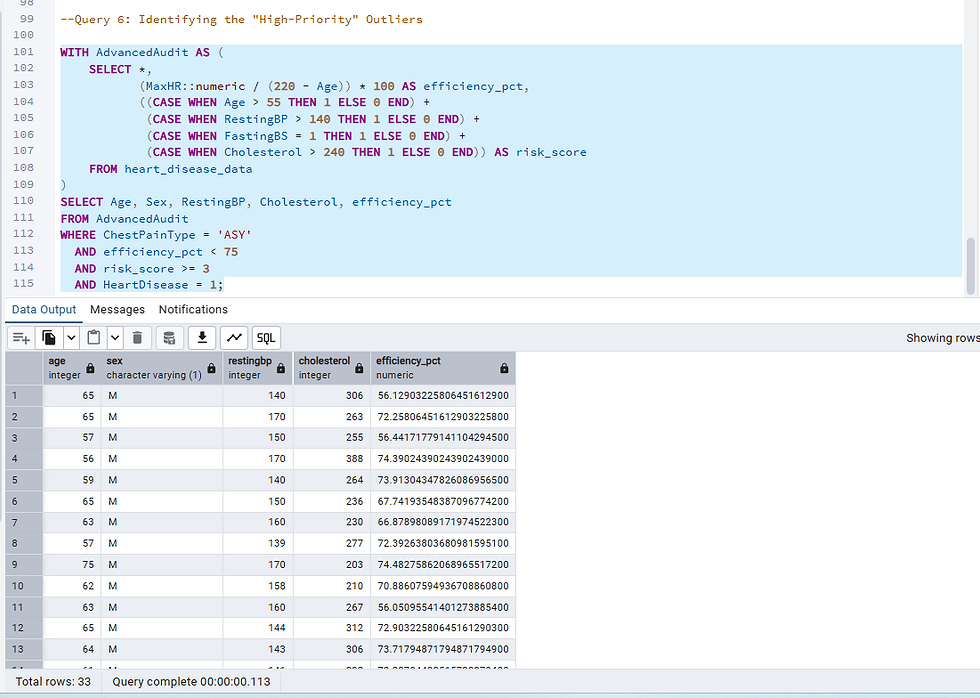
Finding:
· Total 33 patients come in high priority group .
Insight:
This is the ultimate "Red Flag" list. These patients would likely walk out of a standard check-up because they "feel fine." However, our SQL audit reveals they are statistically the most likely to experience a major cardiac event.
Conclusion: The SQL Clinician’s Advantage
We started with a raw CSV and a list of symptoms. Through three layers of SQL analysis, we have:
Exposed the Asymptomatic Paradox: Proved that "No Pain" is a high-risk signal.
Quantified Mechanical Failure: Measured the 10% efficiency gap in diseased hearts.
Built a Predictive Engine: Created a metabolic score that accurately predicts disease with 86% probability.
For the modern data professional, the takeaway is simple: The database is not just a filing cabinet-it is a laboratory. By layering your queries, you can uncover life-saving insights without ever moving your data.


