Tableau expressions cheat sheet: Essential functions for calculated fields

Tableau has a calculated field which has a custom field created by applying more formulas or expressions on existing data fields. It allows the users to perform calculations , Combines the data or apply conditions that are not directly available in the dataset.

The calculated Field helps in deriving new insights , performs advanced analysis and enhances the visualizations without altering the original dataset.
Steps to create a calculated field:
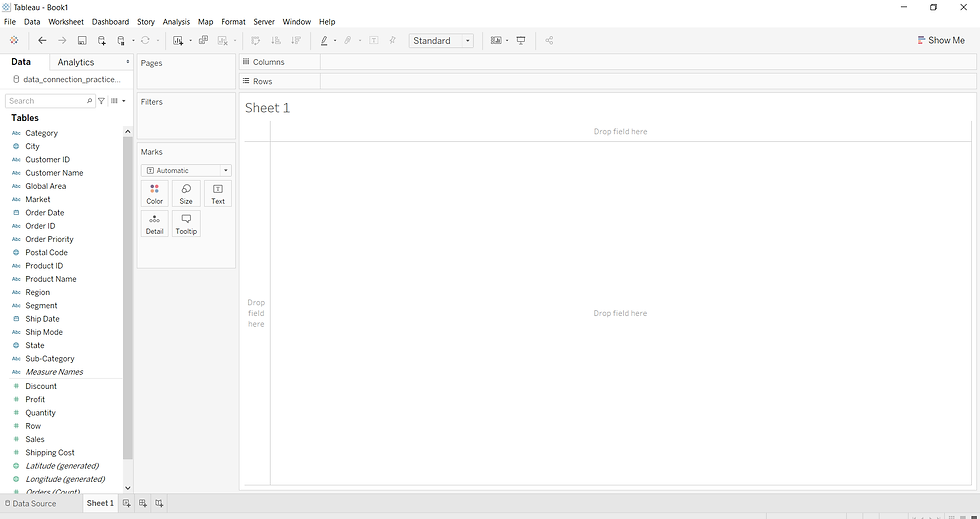
Step 1: Open Tableau and connect to your dataset
Step 2:Drag and drop a sheet from the dataset into the workplace
Step 3: Click on sheets to open the tableau worksheet
Step 4: On the left side , you will see the dataset attributes.
Steps to follow to create a calculated field:
Go to Analysis
Select create calculated field
Enter a name for the field
Write the formula or expression
Click apply and then click ok
The calculated fields will now appear in our datasets field and can be used in visualizations.
Tableau Functions that are needed the most:
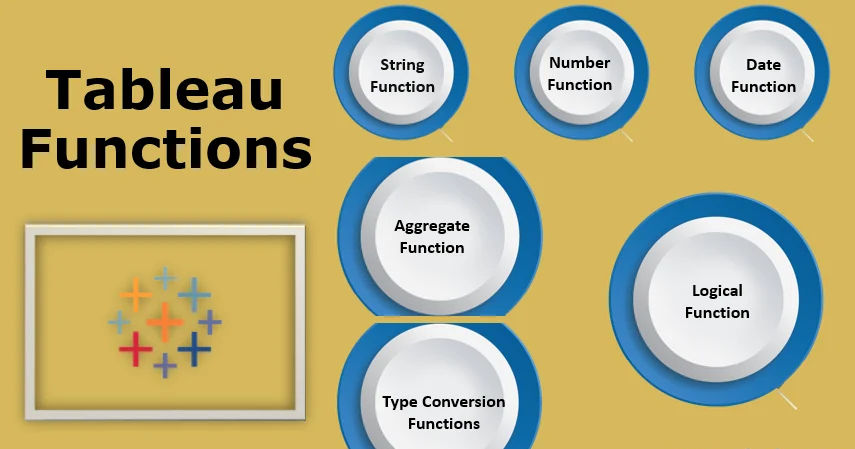
Logical Functions: (Decision maker):
This logical Function is the most used function in tableau. Tableau's logical functions like IF, THEN, ELSE,AND,OR and CASE creates the conditional logic in calculated field. It allows us to test the conditions if it is true /false . This also evaluates conditions sequentially and returns the result for the first true condition.
ion | Syntax Example | Typical Use Case |
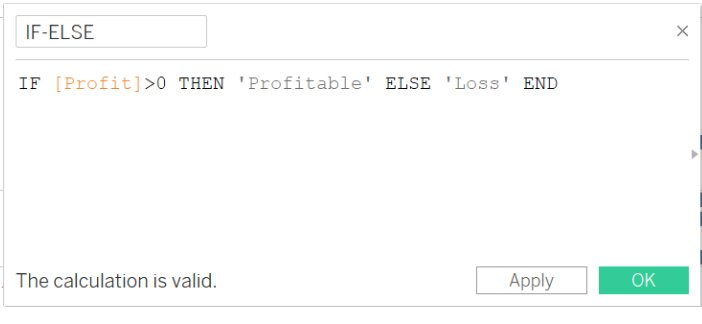
IF / ELSEIF / ELSE | IF [Profit] > 0 THEN "Profitable"<br>ELSEIF [Profit] = 0 THEN "Break-even"<br>ELSE "Loss" END | Categorize KPIs, flag outliers, conditional formatting |
CASE | CASE [Region]<br>WHEN "West" THEN "Pacific"<br>WHEN "East" THEN "Atlantic"<br>ELSE "Other" END | Cleaner alternative to many IFs (exact matches) |
IIF | IIF([Sales] > 100000, "High", "Standard") | Very quick binary conditions |
AND / OR / NOT | [Category] = "Furniture" AND [Sales] > 500 | Combine multiple conditions |
String Functions:
The string functions is one of the category of built in functions which let us to manipulate , transform , search ,extract and format text data. it is mainly used for cleaning the messy data ,searching patterns , standardizing formatting.
Function | What it does | Quick Example | Typical Use Case |
CONTAINS | Checks if text contains a substring | CONTAINS([Product], "Chair") → true/false | Filtering, flagging, conditional logic |
STARTSWITH | Checks if text begins with a substring | STARTSWITH([Order ID], "US-") | Identifying prefixes (region codes, types…) |
ENDSWITH | Checks if text ends with a substring | ENDSWITH([Email], "@gmail.com") | Email domain detection |
LEFT | Takes X characters from the left | LEFT([Name], 3) → "Joh" | Extract initials, prefixes |
RIGHT | Takes X characters from the right | RIGHT([Order ID], 4) | Extract last 4 digits of codes |
MID | Extracts substring from middle (position + length) | MID([Phone], 4, 3) | Extract area code, part of code |
LEN | Returns length of the string | LEN([Name]) | Validate data, find long/short values |
TRIM | Removes leading + trailing spaces | TRIM([Company]) | Clean messy imported data |
LTRIM / RTRIM | Removes spaces only from left / only from right | LTRIM([Comment]) | Partial space cleaning |
UPPER / LOWER | Converts to all UPPERCASE / lowercase | UPPER([State]) → "TEXAS" | Standardize for comparisons/joins |
PROPER | Capitalizes first letter of each word | PROPER("john doe") → "John Doe" | Make names look nice |
REPLACE | Replaces all occurrences of substring | REPLACE([Product], "Table", "Desk") | Correct typos, standardize terms |
SPLIT | Splits string by delimiter & picks nth token | SPLIT([Full Name], " ", 1) → First name | Parse CSV-like fields, names, paths |
FIND | Returns position (index) of substring | FIND([Description], "error") | Locate position before extracting |
FINDNTH | Position of the nth occurrence | FINDNTH([Path], "/", 3) | Advanced parsing of hierarchies |
Number functions:
It is a rules or operations that take the numerical inputs and gives the single numerical output.
Function | Example | Typical Use |
ROUND | ROUND([Profit Ratio], 2) | Clean display numbers |
CEILING / FLOOR | CEILING([Target]/100)*100 | Round up/down to nearest hundred/etc. |
ABS | ABS([Profit]) | Absolute difference / deviation |
MIN / MAX | MAX([Forecast], [Actual]) | Choose higher/lower value |
ZN | ZN([Profit]) | Replace NULL with 0 (very common!) |
Date Functions:
Function | Example | Common Purpose |
DATEPART | DATEPART('quarter', [Order Date]) | Extract quarter, month, weekday… |
DATENAME | DATENAME('month', [Order Date]) | Get month name (January, February…) |
DATEDIFF | DATEDIFF('day', [Order Date], [Ship Date]) | Days/weeks/months between dates |
DATEADD | DATEADD('month', -3, [Order Date]) | Previous quarter/month/year |
DATETRUNC | DATETRUNC('quarter', [Order Date]) | Round to start of quarter/month/year |
MAKEDATE / MAKEDATETIME | MAKEDATE(2026, DATEPART('dayofyear', [Date])) | Rebuild dates |
Aggregation Function :
A Function that combines multiple values from different rows and gives back the single summarized value. It is mainly used when we need to calculate total or average.
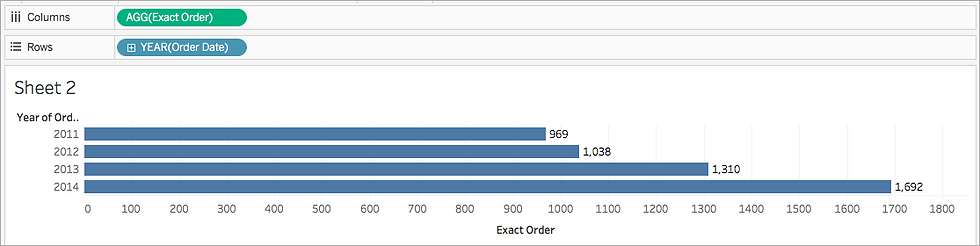
For Example: If you want to know about the count of orders the store had for a particular year then use
COUNTD( Order ID)
Level Of Detail(LOD) Expressions:
It solves the hardest problem in the tableau.
Type | Syntax Pattern | Classic Business Use Cases |
FIXED | { FIXED [Region], [Category] : SUM([Sales]) } | Cohort analysis, % of total at higher level, never changes with filter |
INCLUDE | { INCLUDE [Customer Name] : SUM([Sales]) } | Avg sales per customer, lifetime value per customer |
EXCLUDE | { EXCLUDE [Category] : SUM([Sales]) } | % of total ignoring one dimension, contribution to grand total |
Most Frequently used LOD patterns are :
// 1. % of Total (ignoring some dimensions)
[Sales] / {EXCLUDE [Sub-Category] : SUM([Sales])}
// 2. Customer Lifetime Value (fixed per customer)
{ FIXED [Customer ID] : SUM([Sales]) }
// 3. Overall company average (remains constant)
{ FIXED : AVG([Profit Margin]) }
// 4. Sales compared to category average
[Sales] - { FIXED [Category] : AVG([Sales]) }


