Tableau Data Foundations(part-2)

After covering the detailed topics of data source, data type and data field, I am going to take you to another important topic like Dimension and Measures and Continuous and Discrete.
1.Dimensions and Measures
These two concepts are fundamental to data visualization in Tableau and understanding them is the key to creating insightful and actionable visualizations. Understanding the distinction between dimensions (qualitative) and measures (quantitative) is crucial, affecting how data is displayed and analyzed in Tableau. Mastering these concepts helps newcomers create more insightful visualizations and make data-driven decisions effectively.
Dimensions
Dimensions are categorical data fields that represent qualitative attributes.
They provide context and structure to data, allowing users to segment, group, and categorize information for analysis.
They are typically used on the rows and columns of a visualization, defining the axes of charts and graphs.
Measures
Measures are numerical data fields that represent quantitative values.
They perform calculations, aggregations, and statistical operations on the data.
They are typically used to create quantitative visualizations and provide a quantitative aspect to the data analysis.
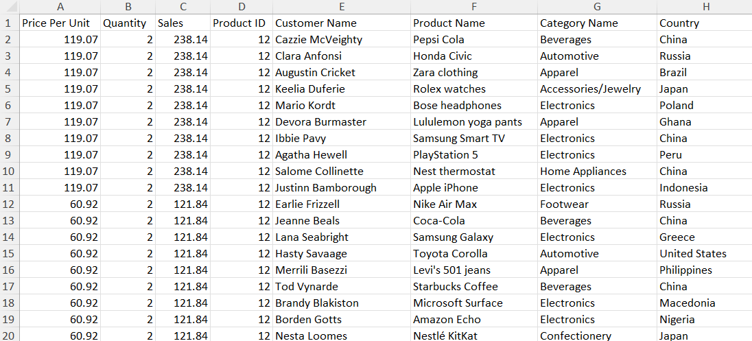
Here we can see in above example that Customer name, Product name and Category name and Country are text data- non numerical data in that you cannot perform any arithmetic operation on the values in this column. for example, you cannot add two customers, right?
In fact, those columns represent discrete values that cannot be measured and aggregate.
Like this we have other columns like Price Per Unit, Quantity and sales by that you can make some arithmetic calculation using the values. for example, sales average, sum of sale or total quantity.
So, all those columns which have fields that are quantitative in nature, can be measured or aggregated and are represented by numbers, percentages or sums are called Measures.
2.Countinues and Discrete
Now that we’ve covered Dimensions and Measures in detail, it’s time to explore another key Tableau concept: the difference between Discrete and Continuous fields.
Discrete values in the tableau are qualitative data such as categories, details, and segments. Which are considered as a title or header for example if we want to calculate the company wise profit details so name of company would be our discrete values which are qualitative data.
Continuous values in the tableau are measurable, quantitative data. In the above case Profit will be our continuous data.
In general, dimensional discrete values and continuous measure values are used in the tableau
In the tableau desktop the blue color value is showing a Discrete value, and the green color value is represented as a Continuous value in Tableau, it’s connected but not actually showing dimension and measure.

This visual explains the five core concepts that drive how Tableau builds every visualization.
It highlights the difference between Dimensions and Measures, the foundation of data structure. The chart clearly shows how Discrete fields create headers while Continuous fields create axes. name of company is the discrete field while Profit is numerical values are the part of discrete field, is a continuous field.
Company‑wise profit bars help demonstrate how Tableau aggregates measures automatically.
Discrete means distinct and separate. They are represented by separate values. Discrete fields contain a finite set of distinct values.
Discrete fields are always in Blue colour in Tableau whether the field is a Dimension or a Measure.
Continuous means unbroken value basically it’s whole, without interruption. They are represented by uninterrupted values.
Continuous fields are always colored Green in Tableau irrespective of the field being a Dimension or a Measure.
One more thing is if the values contain Boolean value like true/false or yes/no it will be show in Dimension fields only.
in dimension if the data is string data type, one cannot make it continuous by right click and same with Boolean data type In case of Boolean values, we cannot change it too continuous.
Continuous vs Discrete Values in Tableau — Steps
here is the example of a chart for better explanation
Step 1 > Connect the “Fact_Sales_data.xlsx” data set. Ensure that your data fields are correctly identified as either continuous or discrete.
Step 2 > Drag discrete fields to the Rows, Columns, or Marks shelf to create categorical groupings in your visualizations. In this case, drag the “Customer name “ dimension and drop it onto the column shelf.
Step 3 > Drag continuous fields to the Rows or Columns shelf to create continuous axes in visualizations like line charts, bar charts, or Scatter plot. In this case, drag the “Sales” measure and drop it onto the Rows shelf.
Step 4 > This creates a Bar chart between customer name and their average Sales.
Step 5 > Finally, change the title of Visualization to Discrete vs. Continuous in Tableau.



