Tableau as a Clinical Watchdog: Alerting Doctors to SIRS Risk

Updated: Jan 12
Sepsis is a serious condition that occurs when the body overreacts to an infection, which can lead to organ damage if not recognized early. Before sepsis develops, many patients show early warning signs known as SIRS (Systemic Inflammatory Response Syndrome) changes in temperature, heart rate, respiratory rate, and white blood cell count that signal the body is under stress. Not every patient with SIRS will develop sepsis, but most sepsis patients first pass through a SIRS stage, making it an important early indicator to monitor.
In this blog, we are focusing on three key concepts that help us understand a patient’s progression. The Trigger Hour is the moment when a patient first shows two or more abnormal SIRS values. The Transition Hour refers to the time just before this trigger, helping us see how quickly the patient’s condition changes. We also look at the SIRS Count, which tells us how many patients meet the threshold of two or more abnormal values.

Image generated by AI
Using Tableau, we can visualize these patterns clearly, track how patients move from early warning signs to potential sepsis, and even set up automated email alerts that notify doctors when a patient crosses SIRS thresholds. This blend of analytics and timely communication strengthens clinical decision‑making and supports faster, safer patient care.
From Numbers to Notifications: Catching SIRS Early
Creating these calculated fields in Tableau is essential because they automatically analyze patient data to spot early warning signs of serious illness, like SIRS, without you having to do any manual calculations.
The SIRS_Condition and SIRS_SCORE fields add up how many of a patient’s vital signs are outside the safe range, making it easy to see who might be getting sick.
The Trigger_hour field pinpoints the exact time when a patient first meets the SIRS criteria, while the Transition Hour shows what was happening just before things got worse.
The Hour_Type field labels each hour as “Trigger,” “Transition,” or not important, so you can quickly focus on the most critical moments. Altogether, these fields turn a mountain of raw numbers into clear, actionable alerts, helping you spot problems early and respond faster, which is especially helpful for beginners or anyone who wants to make sense of complex healthcare data in Tableau.
SIRS_Condition
(IF ([HR]>90) THEN 1 ELSE 0 END)
+(IF ([Temp])>38.5 OR ([Temp]<35) THEN 1 ELSE 0 END)
+(IF ([Resp]>20) OR ([PaCO2]<32) THEN 1 ELSE 0 END)
+(IF ([WBC]>12) OR ([WBC]<4) THEN 1 ELSE 0 END)
SIRS_SCORE
(IF ([HR]>90) THEN 1 ELSE 0 END)
+(IF ([Temp])>38.5 OR ([Temp]<35) THEN 1 ELSE 0 END)
+(IF ([Resp]>20) OR ([PaCO2]<32) THEN 1 ELSE 0 END)
+(IF ([WBC]>12) OR ([WBC]<4) THEN 1 ELSE 0 END)
Trigger_hour
{ FIXED [Patient_ID] : MIN(IF [SIRS_Condition] >=2 THEN [Hour] END) }
Transition Hour
[Trigger_hour]-1
Hour_Type
IF [Hour]= [Trigger_hour] THEN "Trigger"
ELSEIF  [Hour]=[Transition Hour] THEN "Transition"
ELSE 'NULL'
END
Tableau triggers a mail alert using a URL action. Calculated fields help customize the email with patient details, making it easy for clinicians to respond quickly.
This setup turns real-time data into timely action, improving early detection. To sending Email Alter on SIRS patients status to the Docter, we need to create a calculated fields Like E-Mail Subject, E-Mail Body, E-Mail Alert
Email_Subject
IF [Hour]=[Trigger_hour] THEN 'SIRS Patient-Trigger Hour alert' ELSE 'N/A' END
Email_Body
IF [Hour]=[Trigger_hour] THEN
"Hello Doctor! " + "%0A%0D" +  "%0A%0D" +
"Patient:  " + STR([Patient_ID])+ " is at risk of SIRS symptoms with biomarkers at " +
IF ISNULL([Trigger_hour]) THEN "Trigger Hr:N/A %0A%0D"  ELSE "Trigger Hour:  " + str([Trigger_hour]) END + "%0A%0D" +
IF ISNULL([HR]) THEN  'Heart Rate : N/A %0A%0D' ELSE "HR:  " + STR([HR]) + " beats/min" + "%0A%0D"  END +
IF ISNULL([Temp]) THEN 'Temperature: N/A %0A%0D' ELSE "Temp:   " + STR([Temp]) +" °C"  + "%0A%0D"  END+
IF ISNULL([WBC]) THEN 'WBC: N/A %0A%0D' ELSE "WBC:  " + STR([WBC])+ "%0A%0D" END  +
IF ISNULL([PaCO2]) THEN 'PaCO2: N/A %0A%0D' ELSE "PaCO2:  " + STR([PaCO2])  + " mmHg" + "%0A%0D" END +
IF ISNULL([Resp]) THEN 'Resp: N/A %0A%0D' ELSE "Resp:  " + STR([Resp]) + " breaths/min"+ "%0A%0D" END  + "%0A%0D"
+"Thank You!"
END
Email Alert
IF [Hour_Type] = "Trigger"
THEN "Send Email"
ELSE  " No Email"
END
Creating Table with Abnormal Conditions
Drag the Measure Names field from the dataset into the Columns shelf. |  |
Drag the below fields into the Rows shelf.
|  |
Convert the Patient _D field to a Dimension and set it to Discrete (which will display as a blue pill) | 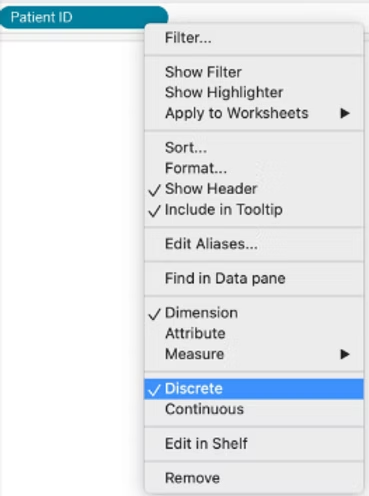 |
Right click SIRS_SCORE field then select Dimension and Discrete options |  |
Add below fields to Filters section
|  |
From the filter section, right click each field and then select ‘edit filters’ option. Apply the change as below

Apply below changes in Marks Card
|  |
When you drag the ‘Measure Values’ field into color marks then it will add all measurable values. Keep only SIRS Criteria measure values like in the screenshot and change the measure values from SUM to AVG |  |
Change the Patient_ID into Attribute |  |
The output table will be displayed in the format shown below:

E-mail Notification configuration
Add this table to dashboard then create an Action for e-mail notification.
Navigate to Dashboard -> Actions

|  |
Click ‘OK’ button to save the E-mail setup |  |
Click on ‘Send Email’ from the table cell to trigger an e-mail notification to the doctor |  |
Sample e-mail notification |  |
Click here for Tableau Public Dashboard
Summary of Insights
Caring for patients at risk of sepsis means constantly watching for the smallest shifts in their vital signs. But in a busy clinical setting, those early clues can easily hide in plain sight. Tableau helps bring those signals to the surface. By converting raw vitals into SIRS scores, identifying Trigger and Transition Hours, and highlighting abnormal patterns, Tableau becomes a quiet partner in patient safety—always scanning, always alert.
The addition of email alerts takes this one step further. Instead of waiting for someone to notice a rising risk on a dashboard, Tableau sends a clear, timely message straight to the doctor. Each alert is built from calculated fields that pull in real patient data, ensuring the message is specific, relevant, and urgent. It’s a simple workflow, but it creates a powerful bridge between data and action.
In the end, this approach turns Tableau into more than a visualization tool. It becomes a clinical watchdog—one that never gets tired, never gets distracted, and never stops monitoring patients who need attention. By blending analytics with real-time communication, we give clinicians the support they need to act early, act confidently, and ultimately improve patient outcomes.
Note
URL Pattern Syntax: ‘mailto:<your email id>?subject=<your email subject>&body=<your email body>’
It is case sensitive.
Example:
Correct - mailto:Rajee2010@gmail.com?subject=<Email_Subject>&body=<Email_Body>
Wrong - mailto:Rajee2010@gmail.com?subject=<Email_SUBJECT>&body=<EMAIL_BODY>
Microsoft Windows will use ‘Outlook’ as a default mail & MacBook will use ‘Apple Mail’ as a default mail
You should be logged into Outlook or Apple Mail to trigger an e-mail notification
Clik here for dataset used in this dashboard
Happy Reading! :)


