Streamlining Your Data Insights: Effective Consolidation of Dashboards in Tableau
Updated: May 2, 2025
“Alone, we can do so little; together we can do so much.” - Helen Keller. This quote beautifully highlights the limitations of individual effort and the power of collaboration. Similarly, standalone dashboards offer only limited insights compared to the rich, comprehensive understanding achieved by consolidating multiple dashboards into a single, unified view.
In our organization, Numpyninja, one of the most sought-after projects is Sepsis. The Sepsis project is conducted to master our skills in Tableau. We were made into teams of 4 or 5 members each. We were working in sprints. Each sprint cycle, all teams did a presentation about the key insights on the topics assigned to them. The last sprint cycle was the consolidation of all 6 weeks' work. All teams collaborated to consolidate all the dashboards into one storyboard to be presented to the entire organization. As we started with the consolidation, Tableau dashboards quickly multiplied, leading to redundancy, scattered insights, and inconsistent user experiences. Consolidating multiple Tableau dashboards into a unified, streamlined solution not only enhances usability but also improves performance, governance, and maintainability. In this blog, we’ll explore the benefits of dashboard consolidation, walk through practical strategies to simplify and optimize your Tableau environment, and share tips for ensuring a smooth transition without compromising data integrity or insight delivery.
Benefits of Dashboard consolidation:
1. Improved User Experience
Multiple views can be combined into a single source, helping users see the full picture at once.
Navigation is simplified by reducing the number of dashboards users need to search through saving time.
Creates a more cohesive and consistent interface, making insights easier to access and understand.
2. Enhanced Performance
Reduces data source redundancy and optimizes queries.
Eliminates duplicate metrics, charts, and KPIs scattered across multiple dashboards.
Streamlined dashboards are often faster, using fewer resources compared to loading many fragmented dashboards.
3. Better Maintainability
Fewer dashboards mean less overhead as everything is in one place rather than spread across several dashboards.
Easier for updates, bug fixes, and version control.
Centralized logic and calculations reduce duplication and inconsistency.
4. Stronger Data Governance
Helps enforce standardized metrics, filters, and business logic across the organization.
Makes it easier to manage permissions and data access from a single source.
5. Improved Decision-Making
Presents a unified view of key metrics and KPIs, allowing for more comprehensive and informed decisions.
Helps break down silos by integrating data from multiple areas into a single, cohesive view.
6. Scalability and Reusability
Modular design allows components to be reused across dashboards or projects.
Supports future growth by offering a framework that can accommodate additional metrics or dimensions without confusion.
7. Reduced Development Time
Eliminates repetitive work by consolidating similar dashboards or reports.
Encourages reuse of templates and standardized visuals.
8. Consistent Storytelling
Delivers a clear, unified narrative to users, making it easier to communicate insights and actions.
9. Increased Collaboration
Centralized dashboards make it easier for teams to collaborate using the same information source.
Consolidating dashboards in Tableau is straightforward when using the Tableau Desktop version. Unlike Tableau Public, Tableau Desktop offers advanced functionality such as the ability to copy and paste dashboards directly, eliminating the need to recreate charts manually. This not only saves time but also conserves development effort and resources.
Now, let’s walk through the steps involved in consolidating dashboards within Tableau Desktop.
1) Open the Tableau desktop.

2) Connect to the data source as shown below.

3) Once the data source is connected, the dataset appears in the Data Source pane.
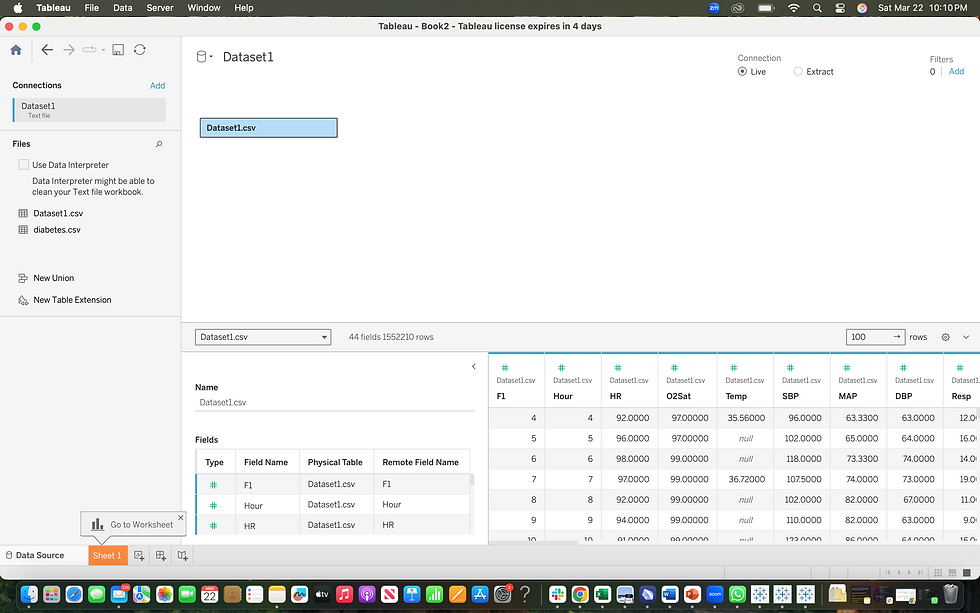
4) Next, go to the dashboard that needs to be included in the consolidated dashboard. Copy the dashboard as shown below.


5) Open a new dashboard in the workbook where the consolidated dashboard is created. Paste the dashboard in it.

After copying the dashboard, the Data tab reveals that the data source has been duplicated. To optimize performance and reduce unnecessary load, the redundant data source should be removed from the workbook.

6) To merge data sources and remove any unwanted duplicates, follow these steps:
a) Right-click on Dataset1 (2) and select ‘Replace Data Source’ from the context menu.

b) Choose the current and replacement data sources as shown below. Click Ok.

c) Next, right click on Dataset1(2) and choose Close.

d) There is no error after closing the second data source. It confirms that we have merged the data sources successfully.

If any errors occur in the table fields or if any visualizations are disrupted, they must be reviewed and resolved before proceeding.
Important: Do not close the original data source being replaced until all issues are fully addressed.
Common issues and best practices during Dashboard Consolidation in Tableau:
Issues | Best Practices |
Duplicate Data Sources: Copying dashboards often leads to duplicated data sources (e.g., Dataset1 (2)), which increases file size and reduces performance | Use ‘Replace Data Source’ to map duplicate sources back to the original, then safely remove the redundant copy. |
Broken Visualizations: Replacing or merging data sources can break visualizations if field names or data structures differ. | Validate each worksheet after merging; use the Field Map pane to remap any broken references manually. |
Field Mapping Conflicts: Fields may not automatically map correctly when switching data sources, requiring manual remapping. | Ensure field names and data types are consistent across dashboards before consolidation. Use aliases or calculated fields if needed. |
Parameter and Filter Mismatches: Filters or parameters in one dashboard may not work properly after merging if the target workbook doesn’t contain equivalent controls. | Recreate or adjust parameters/filters manually and ensure they are applied consistently throughout the consolidated workbook. |
Calculated Fields Discrepancy: Differences in calculated field logic or naming conventions between dashboards can cause errors or confusion. | Standardize calculated field definitions before merging. Rename fields to avoid confusion and ensure functional parity. |
Performance Degradation: Consolidated workbooks with large or multiple data sources may lead to slower load times and laggy interactivity. | Optimize by removing unused fields, aggregating data before import, or using extracts instead of live connections. |
Styling or Layout Inconsistencies: Copied dashboards may retain their original styling, causing visual misalignment or inconsistent branding. | Standardize fonts, color schemes, and layout grids before copying dashboards. Use formatting templates for consistency. |
Dashboard Actions Not Carrying Over: Interactions like filter or highlight actions might not transfer correctly and need to be reconfigured. | Reconfigure actions (filter, highlight, URL, etc.) manually in the consolidated dashboard to ensure proper behavior. |
Version Compatibility Issues: Workbooks created in different Tableau versions may have compatibility issues during consolidation. | Upgrade older workbooks to the same version before merging. Avoid mixing features not supported across versions. |
Loss of Interactivity or Functionality: Complex dashboards might lose dynamic behavior (like tooltips, filters, or sheet swapping) if not carefully managed during the merge. | Test all interactions after consolidation. Use Performance Recorder to debug any issues related to lost functionality. |
Thus, two dashboards have been successfully merged by replacing one data source with another. If additional dashboards need to be incorporated, repeat steps 4 through 6 for each. However, if the dashboards use different data sources, the original data sources must be retained in the consolidated workbook rather than replaced.
Consolidating dashboards in Tableau streamlines data visualization, reduces redundancy, and delivers a more cohesive and insightful user experience. By thoughtfully merging dashboards and managing data sources carefully, organizations can enhance decision-making, improve dashboard performance, and simplify maintenance. While consolidation requires careful planning and validation, the resulting unified view empowers users to access comprehensive insights more efficiently — ultimately driving better business outcomes.


