Simple Diabetes Insights with Power BI and DAX

Introduction
Diabetes Mellitus (DM) can be harder to manage in older adults. As people age, their bodies do not respond to insulin as well as before. Living with diabetes for many years adds stress to the body and changes in body weight and muscle also affect blood sugar levels. Because of this, diabetes care in elderly patients becomes more complex.
In this blog, I analyze diabetes data from older adults using Power BI. The focus is on how HbA1c, BMI category, age group, metabolic markers and diabetes duration are connected. To keep the analysis clear and meaningful, each measure represents one record per patient.

Image Source: tsvmap, guideofgreece (image modified by the author)
Dataset and Analysis Approach
A cleaned and structured version of the data was used for analysis. The dataset includes patient ID, HbA1c values, BMI categories, age groups, diabetes duration, gender and metabolic markers such as fasting glucose.
In clinical data, patients often have multiple lab results. If all these records are averaged directly, the results can be misleading. To avoid this, all calculations were done at the patient level and missing values were removed.
Insight: Glycemic Control Status in Elderly Patients
The first part of the analysis looks at overall blood sugar control. Patients were grouped based on standard HbA1c cutoffs.
DAX Queries:
Controlled = CALCULATE ( DISTINCTCOUNT(DimMetabolicLabs[Patientid] ),
FILTER ( VALUES(DimMetabolicLabs[Patientid] ),
CALCULATE ( MIN(DimMetabolicLabs[HbA1C%] ) ) < 7
&& CALCULATE( NOT ISBLANK(MIN(DimMetabolicLabs[HbA1C%] ) ) ) ) )
UnControlled = CALCULATE ( DISTINCTCOUNT(DimMetabolicLabs[Patientid]),
FILTER ( VALUES(DimMetabolicLabs[Patientid]),
CALCULATE ( MIN(DimMetabolicLabs[HbA1C%] ) ) >= 7
&& CALCULATE( NOT ISBLANK(MIN(DimMetabolicLabs[HbA1C%] ) ) ) ) )
Patient % of Total = DIVIDE ( DISTINCTCOUNT(DimMetabolicLabs[Patientid]),
CALCULATE(DISTINCTCOUNT(DimMetabolicLabs[Patientid]),
ALL(DimMetabolicLabs) )
HbA1c Category = SWITCH (
TRUE(),
DimMetabolicLabs[Patient HbA1c] < 5.7, "Normal",
DimMetabolicLabs[Patient HbA1c] >= 5.7 &&
DimMetabolicLabs[Patient HbA1c] < 6.5, "Prediabetes",
DimMetabolicLabs[Patient HbA1c] >= 6.5, "Diabetes" )
Tot Patient = DISTINCTCOUNT ( DimMetabolicLabs[Patientid] )
Visualizations Used
Pie Chart : Controlled vs Uncontrolled Diabetes
Donut chart: HbA1c Level Distribution
Treemap: HbA1c Classification - Normal / Prediabetes / Diabetes
Pie Chart: Controlled vs Uncontrolled Diabetes
DAX Used: Controlled, UnControlled
Classifies patients as Controlled or Uncontrolled using the latest non-null HbA1c value at the patient level.
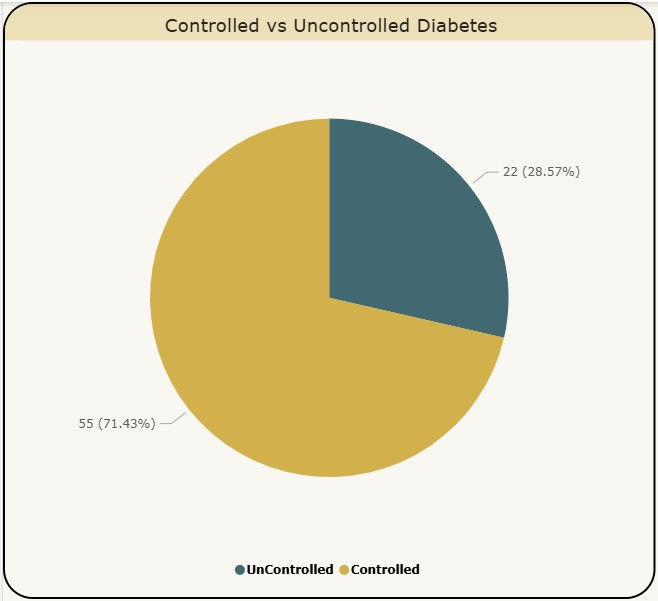
Image Source: Author's Visualization using PowerBI
Donut chart: HbA1c Level Distribution
DAX Used: HbA1c Category, Tot Patient
Shows the proportion of patients classified as Controlled and Uncontrolled based on patient-level HbA1c values.

Image Source: Author's Visualization using PowerBI
Treemap: HbA1c Classification - Normal / Prediabetes / Diabetes
DAX Used: HbA1c Category, Patient % of Total, Tot Patient
Groups patients into HbA1c categories based on their latest available non-null HbA1c value.
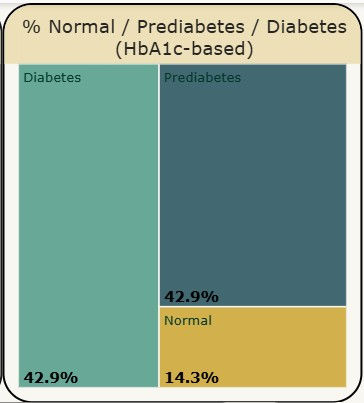
Image Source: Author's Visualization using PowerBI
Most patients fall into controlled or prediabetes groups. However, a noticeable number of patients still have uncontrolled diabetes. Male and female patients show similar patterns, meaning gender does not strongly affect control in this group. The large prediabetes group shows a chance for early treatment.
Insight: BMI and Changes in HbA1c Over Time
This section looks at how body weight affects blood sugar and how HbA1c changes over time.
DAX Queries:
BMI Category = VAR bmi = DimPatient[BMI]
RETURN
SWITCH (
TRUE(),
ISBLANK(bmi), "Unknown",
bmi < 18.5, "Underweight",
bmi < 25, "Normal",
bmi < 30, "Overweight",
"Obese" )
AgeGroup = SWITCH(
TRUE(),
'DimPatient'[age] >= 10 && 'DimPatient'[age] <= 20, "10–20",
'DimPatient'[age] >= 21 && 'DimPatient'[age] <= 30, "21–30",
'DimPatient'[age] >= 31 && 'DimPatient'[age] <= 40, "31–40",
'DimPatient'[age] >= 41 && 'DimPatient'[age] <= 50, "41–50",
'DimPatient'[age] >= 51 && 'DimPatient'[age] <= 60, "51–60",
'DimPatient'[age] >= 61 && 'DimPatient'[age] <= 70, "61–70",
'DimPatient'[age] >= 71 && 'DimPatient'[age] <= 80, "71–80",
'DimPatient'[age] > 80, "80+",
BLANK() )
Visit Time = SWITCH(
TRUE(),
CONTAINSSTRING(DimMetabolicLabs[VisitKey], "-2"), "Baseline",
CONTAINSSTRING(DimMetabolicLabs[VisitKey], "-8"), "2-Year Follow-up",
BLANK() ) )
Avg HbA1c (Visit) = AVERAGEX(
VALUES(DimMetabolicLabs[PatientID]),
[Patient HbA1c (Visit)] )
Visualizations Used
Matrix chart: HbA1c by Age Group and BMI Category
Ribbon chart: Relative HbA1c Ranking
Matrix chart: HbA1c by Age Group and BMI Category
DAX Used: Tot Patient, BMI Category, Age Group
Counts patients by age group and BMI category using patient-level HbA1c values.
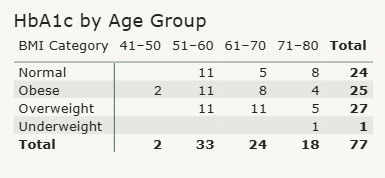
Image Source: Author's Visualization using PowerBI
Ribbon chart: Relative HbA1c Ranking
DAX Used: BMI Category, Visit Time, Avg HbA1c (Visit)
Ranks BMI categories based on average patient-level HbA1c values over time. Note:Ribbon height reflects relative ranking across BMI categories and does not represent absolute HbA1c value.
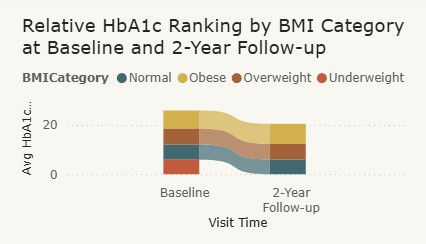
Image Source: Author's Visualization using PowerBI
Patients in the obese group consistently show higher HbA1c levels. Overweight patients follow next, while normal-weight patients have better control. Over time, HbA1c tends to increase in obese patients, while it stays more stable in patients with normal BMI. This shows that BMI has a long-term effect on blood sugar control.
Insight: Metabolic and Cardiovascular Relationships
This part connects blood sugar levels with metabolic and cardiovascular markers.
DAX Queries
Metabolic Waterfall Value = SWITCH(
SELECTEDVALUE('Metabolic Stage'[Stage]),
"Fasting Glucose", [Avg Fasting Glucose],
"Insulin Resistance (HOMA-IR)", [Avg HOMA1 IR],
"HbA1c", [AvgHbA1c] )
Metabolic Stage = DATATABLE(
"Stage", STRING,
"Order", INTEGER,
{ {"Fasting Glucose", 1},
{"Insulin Resistance (HOMA-IR)", 2},
{"HbA1c", 3} } )
Avg Cardio Value (Per Patient) = SWITCH (
SELECTEDVALUE ( 'Cardio Biomarker'[Biomarker] ),
"CRP", [Avg crp],
"LDL", [Avg LDL],
"Cholesterol", [Avg chol],
"SBP", [avg 24hr_sbp_night],
"DBP", [avg 24hr_dbp_night] ,
"MBP", [avg 24hr_mbp_night],
"Heartrate", [avg 24hr_hr_night] )
Biomarker Selector = DATATABLE ( "Biomarker", STRING, { { "LDL" }, { "HDL" }, { "Tryglyc" }, { "ACR" } })
Selected Biomarker Avg = SWITCH (
SELECTEDVALUE ('Biomarker Selector'[Biomarker] ), "LDL", AVERAGE ( DimMetabolicLabs[Ldl Calcmg/Dl] ), "HDL", AVERAGE ( DimMetabolicLabs[Hdl Mg/Dl] ), "Tryglyc", AVERAGE ( DimMetabolicLabs[Triglycmg/Dl] ), "ACR", AVERAGE ( DimRenal[ACR (mg/g)] ) )
Visualizations Used
Waterfall chart: Metabolic Progression (Glucose - Insulin Resistance - HbA1c)
Heatmap: HbA1c vs Cardiovascular Outcomes
Scatter with slicer: HbA1c vs Selected Biomarkers
Waterfall chart: Metabolic Progression (Glucose - Insulin Resistance - HbA1c)
DAX Used: Metabolic Waterfall Value, Metabolic Stage (Table)
Uses patient-level average measures to illustrate the progression from fasting glucose to insulin resistance and HbA1c, showing relative metabolic changes rather than cumulative totals.

Image Source: Author's Visualization using PowerBI
Heatmap: HbA1c vs Cardiovascular Outcomes
DAX Used: Avg Cardio Value (Per Patient), HbA1c Category
Calculates patient-level averages for cardiovascular biomarkers (e.g., LDL, SBP, DBP, CRP) and compares them across HbA1c categories.

Image Source: Author's Visualization using PowerBI
Scatter with slicer: HbA1c vs Selected Biomarkers
DAX Used: Biomarker Selector(Table), Selected Biomarker Avg, HbA1c Category
Uses a disconnected slicer to dynamically display patient-level averages for selected biomarkers in relation to HbA1c.

Higher fasting glucose leads to insulin resistance and higher HbA1c. Scatter plots show a clear positive relationship between fasting glucose and HbA1c. Heart-related risk markers increase as HbA1c rises and risk is visible even in pre-diabetes patients. This shows that damage can begin early.
Insight: Age, Diabetes Duration and Risk
The final section looks at how long patients have had diabetes and how this relates to age, BMI and gender.
DAX Queries
Avg Diabetes Duration = AVERAGEX (
VALUES(DimPatient[PatientID]),
[Patient Diabetes Duration])
Visualizations Used
Decomposition tree: Diabetes Duration Across Age Groups
DAX Used: Avg Diabetes Duration, BMI Category, Age Group
Calculates average diabetes duration per patient and decomposes results by age group to explore duration patterns.

Image Source: Author's Visualization using PowerBI
Older patients, especially those aged 71–80, have lived with diabetes for longer. However, long duration alone does not explain poor control. Some obese patients show worse blood sugar even with shorter disease duration, suggesting faster progression. Gender differences are small, with slightly longer duration seen in female patients.
Conclusion
This blog shows how Power BI and DAX can be used to analyze elderly diabetes data in a clear and patient-focused way. By using one record per patient and removing missing values, the analysis avoids common errors and produces reliable insights. The results confirm known clinical patterns, such as the strong effect of obesity on blood sugar control and also highlight early heart-related risk in prediabetes. Well-designed dashboards do more than show numbers, they help explain what is happening and support better understanding and decision-making.
References
PhysioNet – Clinical Data for Elderly Diabetes - https://physionet.org/content/cded/1.0.1/
Dataset link - https://docs.google.com/spreadsheets/d/1sGS2kafWDFbM1JEyMJyHCsH_fzet9A2T/edit?usp=drive_link
DAX Reference Guide - https://learn.microsoft.com/dax/


