Simple Data Cleaning Tips That Make Analysis Easier
When starting out in data analytics, it’s easy to assume that most of the work happens during analysis or visualization. In reality, a large part of the effort goes into something far less glamorous — data cleaning.
Real-world data is rarely perfect. It often comes with missing values, duplicates, inconsistent formats, or unexpected outliers. Learning how to handle these issues early can save a lot of time and confusion later.
This blog shares a few practical data cleaning tips and hacks using Python, based on common challenges that analysts encounter while working with real datasets. The focus is not on advanced techniques, but on simple steps that make data more reliable and analysis more meaningful.
Before jumping into cleaning techniques, it’s important to first get familiar with the data itself.
1. Understand the Data Before Cleaning It
Before applying any cleaning logic, it is important to first explore and understand the dataset. Some useful questions to ask include:
What does each column represent?
Are there missing or unexpected values?
Do the data types align with what the column names suggest?
In Python, basic inspection methods are often enough to uncover early issues:
df.head()
df.info()
df.describe()
These basic steps help identify:
Columns with too many missing values
Incorrect data types (numbers stored as text)
Values that don’t match expectations
These steps help identify columns with missing values, incorrect data types, and values that fall outside expected ranges. Taking time to understand the data upfront often prevents incorrect assumptions later.
Before jumping into specific cleaning techniques, getting familiar with the data sets the foundation for all further steps
2. Handle Missing Values Thoughtfully
Missing values are one of the most common issues encountered during data cleaning. While it may be tempting to handle them quickly, thoughtful decisions lead to better outcomes.
Before taking action, it helps to understand why values are missing. In some cases, missing data might indicate that the information was not collected, while in others it may simply not apply.
To assess missing values:
df.isnull().sum()
Common approaches include:
Drop rows only if missing data is minimal
Fill numerical values with mean or median
Use a placeholder like “Unknown” for categorical columns
The key is to choose the approach that makes sense for the data, not just the easiest one.
After handling missing data, another issue that often affects data quality is the presence of duplicate records.
3. Remove Duplicates, but Verify First
Duplicate records can significantly impact analysis, especially when working with counts, totals, or averages.
Before removing duplicates, it is useful to confirm whether they are truly redundant or whether they exist for a valid reason.
df.duplicated().sum()
To remove exact duplicates:
df = df.drop_duplicates()
In some datasets, duplicates may only exist across certain columns, such as IDs or timestamps. In such cases, more selective logic may be required.
After handling missing values, checking for duplicates helps ensure the data accurately represents real observations.
4. Fix Inconsistent Formats
Even after removing duplicates, datasets often contain inconsistencies in formatting. Common examples include:
Dates stored as text
Multiple date formats within the same column
Inconsistent capitalization in text fields
Converting date columns properly helps standardize the data:
df['order_date'] = pd.to_datetime(df['order_date'], errors='coerce')
Text fields can also be cleaned using simple string operations:
df['city'] = df['city'].str.strip().str.lower()
Standardizing formats improves filtering, grouping, and aggregation accuracy. With formats standardized, it becomes easier to notice values that stand out from the rest of the data
5. Detect Outliers Instead of Ignoring Them
Outliers are values that fall far outside the normal range of the data. While some outliers may indicate errors, others may represent valid but rare cases.
A quick visualization can help spot unusual values:
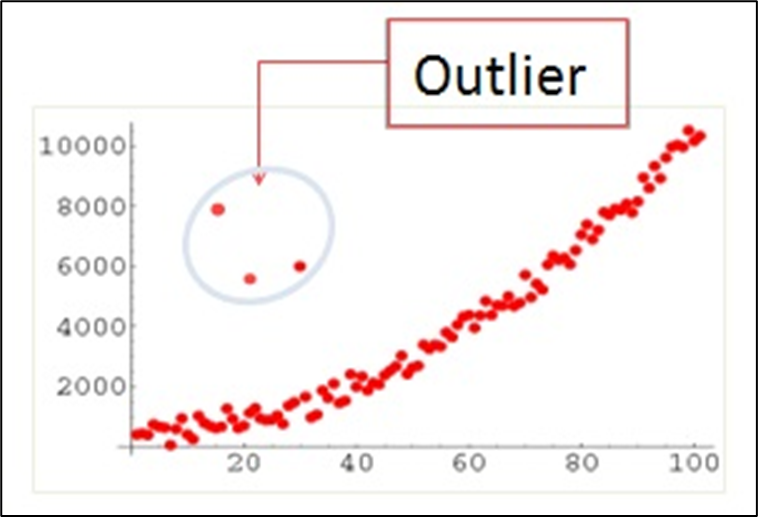
Instead of automatically removing outliers:
Investigate their cause
Decide whether they are errors or valid data points
Outlier handling should always align with the business or analytical context. Any changes made during cleaning should be reviewed to ensure they have not introduced new issues.
6. Recheck the Data After Cleaning
Data cleaning is rarely a one-step process. After making changes, it’s important to review the dataset again:
df.info()
df.describe()
This helps confirm:
Missing values are handled correctly
Data types are consistent
No unexpected rows were removed
This final review helps confirm that data types are consistent, missing values are handled appropriately, and no unintended changes were introduced.
7. Validate Data Ranges and Business Rules
Even if the data looks clean, it’s important to check whether the values actually make sense.
For example:
Ages should not be negative or unrealistically high
Prices should not be zero if a transaction exists
Percentages should stay within expected limits
In Python, simple conditional checks help identify such issues:
df[df['age'] < 0]
df[df['price'] <= 0]
These checks help catch errors that may not be obvious during initial inspection but can significantly impact analysis results. Finally, keeping the cleaning process simple and well-documented helps make the analysis easier to understand and reuse.
8. Keep Data Cleaning Steps Simple and Documented
Data cleaning often involves multiple small steps. Writing overly complex logic can make the process difficult to understand or reproduce later.
A good practice is to:
Apply cleaning steps in a clear sequence
Use meaningful column names
Add short comments explaining why a step is needed
For example:
df['order_date'] = pd.to_datetime(df['order_date'], errors='coerce')
Clear and readable cleaning logic makes it easier for others — and for your future self — to understand the work that was done.
Final Thoughts
Data cleaning may not be the most exciting part of data analytics, but it plays a crucial role in ensuring accurate insights. Clean data leads to clearer analysis, better visualizations, and more confident decisions.
For anyone growing in data analytics, improving data cleaning skills is a gradual process. Each dataset brings new challenges, and every mistake becomes a learning opportunity.
Focusing on understanding the data first and applying thoughtful cleaning techniques makes the entire analytics workflow smoother and more effective!
Thank you for reading, and happy learning!


