Retail Analytics Case Study: Transforming Customer Data into Strategy

In today’s retail environment, data is the compass for growth. For this project, I acted as a Data Analyst to transform a dataset of 3,900 transactions into a strategic roadmap for business success. Using a professional stack of Python, SQL, and Power BI, I built a complete pipeline to uncover how demographics and shopping behaviors drive revenue.
The Technical Toolkit
Data Preparation: Python (Pandas & NumPy)
Relational Analysis: PostgreSQL
Visualization: Power BI
Version Control: GitHub
Phase 1: Cleaning & Engineering (The "Why" Behind the Code)
Raw data is rarely ready for a boardroom. I used Python to audit the structure and perform "intelligent" cleaning. In data science, we say "Garbage In, Garbage Out." While the dataset had 3,900 rows, the challenge was ensuring the 18 features spoke the same language.
Key Technical Decisions:
1.Understanding The Data :
Before cleaning any data i prefer to understand what the data is all about like howmmanyh columns rows what are the colum names and whatare the data types and null values and so on and the job is very easy when it has to be done in python a simple code helps us understand our data better.
Python: df.info() gives us the information about everything in the data set gvivng us the clarity as to what to work on.

2.Beyond Basic Imputation
Finding 37 missing values in the Review Rating column presented a choice. Instead of a simple global average, I used Categorical Median Imputation:
Python:
df['review_rating'] = df.groupby('Category')['review_rating'].transform(lambda x: x.fillna(x.median()))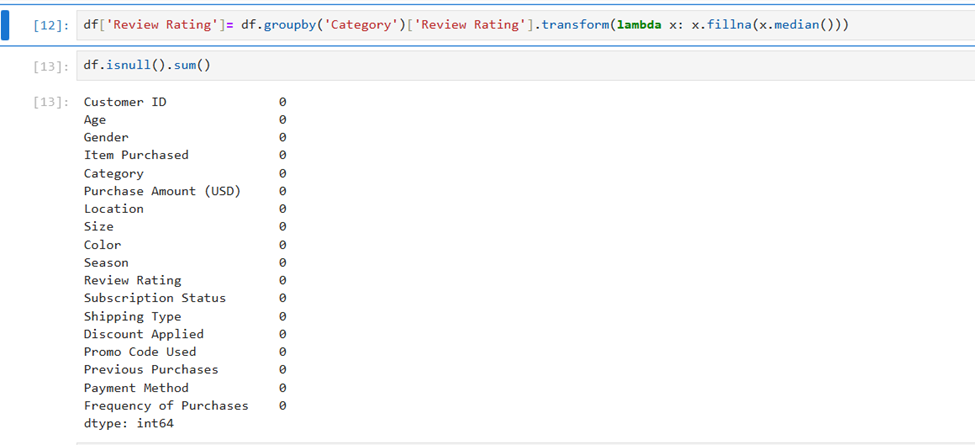
By filling nulls with the median rating within each category, we respect that a "High-End Coat" has different rating standards than "Socks." Using the median also ensures outliers don’t skew our results.
3. Standardizing for SQL Compatibility
To ensure the data was ready for a PostgreSQL relational database, I converted all column names to snake_case.
Action: Removed spaces, converted to lowercase, and renamed units (e.g., purchase_amount_(usd) becomes purchase_amount).
Result: Error-free queries and consistent coding standards.
4. Engineering New Perspectives
Raw data often hides the best insights. I engineered two key features to add depth to the analysis:
Age Segmentation: Used pd.qcut to create four distinct groups: Young Adult, Adult, Middle Aged, and Senior.
Frequency Mapping: Transformed textual data (e.g., "Fortnightly") into numerical values (14 days) to allow for mathematical trend calculations.

5. Eliminating Redundancy
By running (df['discount_applied'] == df['promo_code_used']).all(), I discovered the two columns were identical. I dropped the redundant column to optimize memory and avoid duplicate bias in future modeling.
Phase 2: Relational Analysis (PostgreSQL)
After cleaning, I established a connection to PostgreSQL using SQLAlchemy. Moving data to a relational database ensures scalability; unlike a flat CSV, a database can handle millions of rows as the business grows.
Advanced Business Insights:
Revenue Concentration: My SQL queries revealed that Male customers generate 68% of total revenue. This forces a strategic question: Is our marketing too male-centric, or is there an untapped female market we are failing to reach?

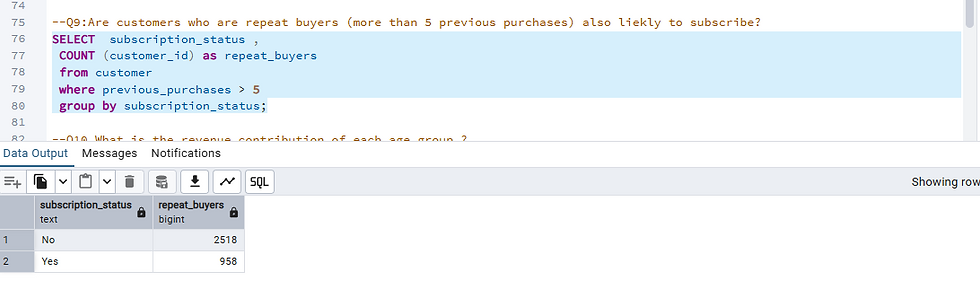
The Subscription Paradox: I joined purchase history with subscription status and found that 2518 repeat buyers are non-subscribers.
Surprisingly, the average spend of a subscriber ($59.49) is nearly identical to a non-subscriber ($59.87). This indicates that our current subscription model offers "access" but hasn't yet incentivized higher individual transaction values.

Precision Math: I used decimal math in SQL to calculate discount effectiveness, avoiding common "integer division" errors that can cost companies thousands in miscalculated margins.
Phase 3: Interactive Visualizations (Power BI)
I built a professional-grade dashboard to make these insights accessible to stakeholders. A dashboard shouldn't just look pretty; it should answer a business question in five seconds.
Design Highlights:
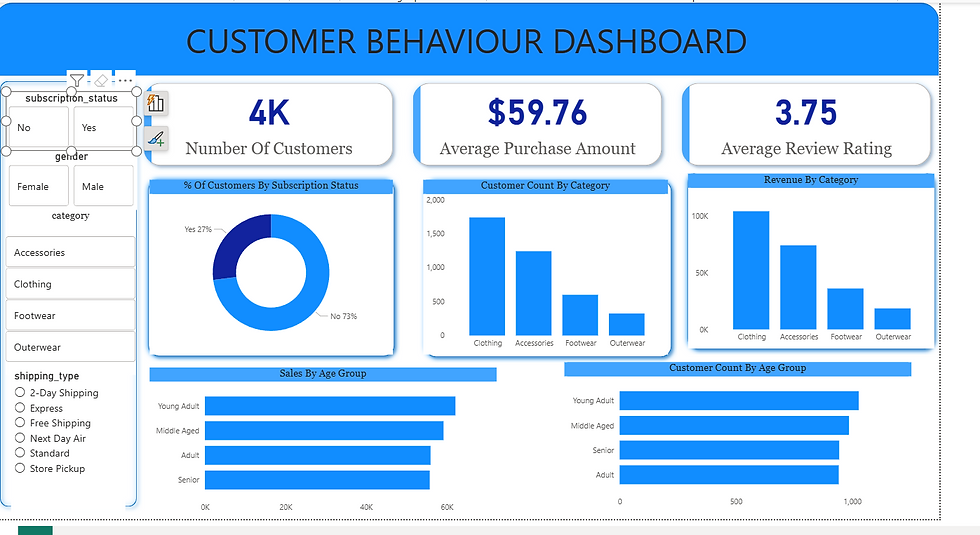
Dynamic UX: I added interactive slicers for Gender, Category, and Shipping Type. I mastered the Selection Pane to manage layer order, ensuring that background design elements never cover the charts while allowing users to toggle between different data views.
KPI Tracking: The dashboard provides instant visibility into the $59.76 average purchase and the 3.75 average review rating.
The Power of Filtering: By visualizing "Revenue by Age Group," we immediately see that Young Adults are the primary revenue drivers, contributing $62k to the bottom line.
Phase 4: Version Control & Documentation (GitHub)
A professional data project is defined by its transparency and reproducibility. I hosted the entire lifecycle of this analysis on GitHub to demonstrate my ability to manage source code and document complex technical processes.
Inside the Repository:
Structured Folders: Organized into dedicated directories for raw data, Python scripts, SQL queries, and Power BI reports.
The README: A comprehensive guide outlining project goals, tools, and installation instructions.
The .ipynb Notebook: Contains the end-to-end cleaning logic, from the initial data audit to the final PostgreSQL export.
Final Project Analysis & Business Impact
By connecting these tools, I moved beyond simple calculations to find the "Why" behind the numbers. Here is the 3-Point Strategic Playbook derived from the pipeline:
The "Loyalty-to-Subscriber" Bridge: My analysis revealed 2,518 repeat buyers (5+ purchases) who are NOT yet subscribers. These are our most loyal customers, yet we haven't converted them. A targeted "Subscriber Conversion" campaign for this group is the single biggest growth opportunity.
Product Optimization: Items like Hats and Sneakers are "Discount-Dependent" (nearly 50% of sales happen with a discount). Conversely, Gloves and Sandals are high-rated (3.8+) and sell well at full price. We should protect the margins on "Stars" and use the "Discount-Dependent" items as traffic drivers.
Operational Efficiency: Standardizing the data into a relational PostgreSQL database reduced redundancy and improved query performance for all future reporting cycles.
Conclusion
This project was a deep dive into the Data Analyst Lifecycle. From identifying the business problem and cleaning messy data to visualizing the solution and documenting it for the community, I’ve learned that the true value of an analyst is translating "bits and bytes" into "business and budgets."
Explore the Project on GitHub: https://github.com/snehabhutada13/customer-behaviour-analysis
HAPPY LEARNING!


