RealityCheck

Note : I am using a Patient Dataset which captures patient visits with key clinical measurements, including age, diabetes duration, fasting glucose, and blood pressure dipping patterns. By focusing on these variables, we can explore how glucose and blood pressure behaviors relate to patient health over time.
Picture this:
You're running your final analysis. The dashboard looks beautiful. The charts are crisp. Numbers are... Wait.
Patient glucose: 487 mg/dL
Is that... normal? You're not a doctor, but that seems high. Like, really high.
You Google it.
"Normal fasting glucose: 70-100 mg/dL" "Diabetes: 126+ mg/dL" "Medical emergency: 300+ mg/dL"
OH.
Your clean database just tried to tell you a patient was in a life-threatening coma... while sitting comfortably in a clinic chair.
Welcome to my data quality wake-up call.
The Moment Everything Changed
I was three weeks into analyzing diabetes patient data. Clean schema. Foreign keys everywhere. The team was pleased.
Then I sorted by glucose values - just out of curiosity.

Huh. An interesting outlier.
That number wasn’t just wrong. It was catastrophically wrong. And I’d been treating it like just another data point. It was supposed to be 148.7 mg/dL. Someone had fat-fingered a decimal point during data entry. And I almost didn’t catch it.
The “Oh No” Moment (Starring Basic Math)
Let me show you what that one typo would have done.
With the error:
Average glucose: 106.3 mg/dL
Clinical interpretation: Mild hyperglycemia
Without the error:
Average glucose: 103.1 mg/dL
Clinical interpretation: Borderline prediabetes
One misplaced decimal point led to a 3.2 mg/dL difference, resulting in different conclusions and entirely different clinical implications.
The Framework I Built (So You Don’t Have My Panic Attack)
After that near-miss, I created a three-layer SQL validation system. Think of it as your database’s TSA checkpoint—annoying, but it catches the dangerous stuff.
Layer 1: Before doing anything fancy, make sure you're actually working with real, unique patients and complete records.
The Duplicate
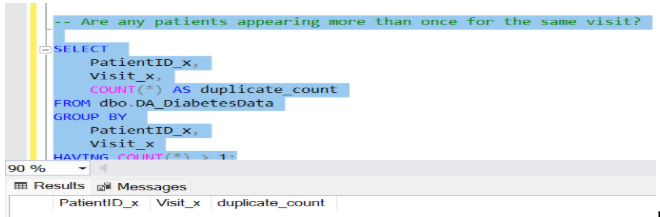
What I found: Zero duplicates.
The "Missing Data" Check
SELECT
COUNT(*) AS total_records,
COUNT(*) - COUNT(Patient_ID) AS missing_ids,
COUNT(*) - COUNT(Age) AS missing_ages,
COUNT(*) - COUNT(Visit_No) AS missing_visits,
ROUND(100.0 COUNT(Age) / COUNT(), 1) AS pct_have_age
FROM patient_data;
My result
total_records | missing_ids | missing_ages | missing_visits | pct_have_age
------------- -|------------- |-------------- |--------------- -|-------------
121 | 0 | 2 | 0 | 98.3%
I had 2 patients with no age recorded. Not ideal, but at least I knew about it before analyzing age-related patterns.
The lesson: Imagine calculating "average glucose per patient" when Patient SO301 shows up three times for the same visit, or when 20% of your patients have NULL ages. Your results would be meaningless.
Layer 2: When Numbers Lie
My data was clean. No duplicates. No missing keys. And that’s when it almost fooled me.
Because a number can be perfectly valid in a database and still be completely wrong in real life.
The Glucose That Broke My Trust
SELECT PatientID_x, Fasting_Glucose
FROM dbo.DA_DiabetesData
WHERE Fasting_Glucose >= 300;

It was supposed to be 148.7.One missed decimal point. Zero database errors. A completely different clinical story.
The Easiest Lie to Spot
When I ran the "zero blood pressure" check, I didn’t get clean zeros. What I got was worse. Values like 0.11, 0.06, even negative blood pressure.
To the database, these are perfectly valid numbers. But to human physiology, they’re not correct.
The patient wasn’t hypotensive. The data had lost its unit context.

The scariest lies weren’t zeros , they were tiny decimals that looked harmless but meant absolutely nothing clinically.
Layer 3: The Hidden Patterns
This is the advanced stuff , finding problems that don't look like problems until you do the math.
The Blood Pressure Dipping Detective
Healthy people's blood pressure "dips" (decreases) 10-20% at night. It's normal physiology.
Reverse dippers (BP higher at night) have cardiovascular risk. Extreme dippers (>20% drop) might have issues too.
Let's find them:

Found: 2 extreme dippers (>20% nighttime BP drop) and 21 reverse dippers (higher nighttime BP).
Are these errors? No , they’re clinically validated patterns and real cardiovascular risk markers . So not all outliers are mistakes. Some are just… interesting
The One Query I Run Before Everything Now
I got tired of running 10 different validation queries. So I built one master query that tells me everything I need to know in 30 seconds:

Output:
check_name | result
------------------------|--------
Total Records | 121
Unique Patients | 77
Duplicate Records | 0
Age Completeness | 98.3%
Glucose Completeness | 100.0%
Extreme Glucose (>300) | 3 - THERE'S MY 487
Zero BP Readings | 5
This query now runs first. Before visualizations. Before analysis. Before anything.
Speed Run
When you have time constraints for a detailed validation framework. You can follow this.
Query 1: The Sanity Check
SELECT
COUNT(*) AS records,
COUNT(DISTINCT PatientID_x) AS patients,
COUNT(*) - COUNT(DISTINCT CAST(PatientID_x AS VARCHAR) + '-' + CAST(Visit_x AS VARCHAR)) AS duplicates
FROM dbo.DA_DiabetesData;
Query 2: The NULL Hunter
SELECT
COUNT(*) - COUNT(PatientID_x) AS missing_ids,
COUNT(*) - COUNT(Diabetes_Duration) AS missing_critical
FROM dbo.DA_DiabetesData;
Query 3: Range Reality Check (example with glucose)
SELECT
MIN(Fasting_Glucose) AS min_glucose,
MAX(Fasting_Glucose) AS max_glucose
FROM dbo.DA_DiabetesData;
Look for min < 40 or max > 400 (or whatever makes sense for your data)
Query 4: The Outlier Exposer
SELECT PatientID_x, Fasting_Glucose
FROM dbo.DA_DiabetesData
WHERE Fasting_Glucose > 300
OR Fasting_Glucose < 40;
Look for: Anything that makes you go "wait, WHAT?"
The Three Things I Learned (The Hard Way)
1. Validate First
Old me: I'll just quickly calculate some averages
Current me: Show me the min, max, nulls, and duplicates or I'm not touching this data.
2. Document Everything

When my lead asked, "How did you handle outliers?" — I had receipts.
3. Perfect Data Is a Myth (And That's Fine)
My final dataset:
121 records analyzed
2 missing ages (documented)
5 equipment failures (marked as NULL)
10 extreme values (clinically validated)
And that's okay.
I didn't have perfect data. I had documented, understood data. That's the goal.
Your Turn
Open your database right now. Run this:
SELECT MIN(your_numeric_field), MAX(your_numeric_field)
FROM your_table;
I bet you find something interesting.
Maybe it's a 487 glucose. Maybe it's a negative age. Maybe it's a birth date in the year 2157.
But I guarantee you'll find something.
Because data is messy. Data lies. And data doesn't validate itself.
Got a data quality horror story? Drop it in the comments.


