Predicting Sepsis and Organ Failure with Data: A Healthcare Analytics Case Study


Sepsis is a life-threatening condition caused by the body's overwhelming response to infection, which can rapidly lead to tissue damage, organ failure, and death. Despite advances in medical science, early diagnosis remains a challenge—especially when symptoms overlap with other clinical conditions.
In this healthcare analytics project, I aimed to use data science techniques to better understand sepsis progression, identify early warning indicators, and assess organ-specific impacts. Drawing from real-world clinical data, I focused on creating a comprehensive analytical and visual framework that could support early diagnosis and risk monitoring.
Understanding Patient Risk Through Demographics
The analysis began with examining demographic patterns among patients diagnosed with sepsis. By segmenting data by age, gender, and hospital length of stay, I identified that older adults—particularly those aged 65 and above—were significantly more susceptible. Male patients and those with prolonged hospitalizations also had higher sepsis rates. These insights laid the groundwork for risk stratification and pre-screening.
Identifying Early Warning Signs with SIRS Criteria
To detect the early stages of sepsis, I applied the Systemic Inflammatory Response Syndrome (SIRS) criteria, which include abnormalities in temperature, heart rate, respiratory rate, and white blood cell count. The majority of sepsis patients in the dataset had already triggered two or more of these criteria before formal diagnosis, underscoring their predictive power. By visualizing these markers over time, I demonstrated how small changes could signal an impending crisis.
Tracking the Impact on Major Organ Systems
Sepsis rarely stays localized—it spreads and compromises critical organ functions. Organ Dysfunction Across Six Systems:
Lungs: Respiratory rate, PaO2/FiO2 ratio
Liver: Bilirubin levels
Kidneys: Creatinine, urine output
Brain: Glasgow Coma Scale (GCS)
Heart: Mean arterial pressure (MAP), vasopressor usage
Blood: Platelet count and clotting factors
By grouping patients by severity and comparing lab values over time, I created organ-specific deterioration dashboards. The visualization clearly showed:
Early renal and lung dysfunction in many cases
Progressive liver and neurological issues in severe stages
Insight: Organ-specific trendlines can act as decision support for clinicians during treatment escalation.
Recognizing the Danger of Septic Shock

Septic shock is the most severe and life-threatening stage of sepsis, marked by profound circulatory, cellular, and metabolic abnormalities. When the body can no longer maintain blood pressure and adequate organ perfusion, the patient’s risk of mortality increases dramatically.
In this project, one of the most critical parts of the analysis was identifying patients who transitioned from sepsis to septic shock. I focused on three key clinical markers that typically signal the onset of this dangerous stage:
Mean Arterial Pressure (MAP): A sustained drop below 65 mmHg often indicates poor perfusion.
Lactate levels: Elevated serum lactate (>2 mmol/L) reflects cellular hypoxia and anaerobic metabolism.
Vasopressor use: Requiring medications to maintain blood pressure, such as norepinephrine, is a red flag for shock.
By analyzing these variables across patient timelines, I observed a rapid transition window—many patients escalated to septic shock within 24 to 48 hours after initial sepsis indicators were recorded.
Key Findings:
Patients with low platelet counts, elevated bilirubin, and increasing SOFA scores were significantly more likely to deteriorate into septic shock.
Shock development was often preceded by a noticeable spike in lactate and a drop in MAP, even before clinical intervention.
Some patients began vasopressor therapy hours before being officially labeled as having “septic shock”—highlighting a gap in diagnostic timing.
This analysis reinforces a vital clinical truth: septic shock doesn’t happen all at once—it builds, and often silently. Timely identification of these subtle signs can give clinicians a crucial head start.
By tracking MAP, lactate, and vasopressor trends through visual dashboards, hospitals could:
Proactively flag at-risk patients before shock onset
Prioritize ICU admissions based on real-time deterioration risk
Allocate resources more effectively during surges
In future iterations, combining these variables with machine learning models could help predict septic shock onset even earlier, offering a real-time alerting mechanism embedded into Electronic Health Record (EHR) systems.
Takeaway: Septic shock is the tipping point in sepsis care—by catching it before it happens, we can dramatically improve patient outcomes. Data can be the difference between crisis management and life-saving foresight.
Measuring Organ Failure Risk with SOFA Scores
In critical care, timing is everything—and one of the most powerful tools clinicians have to assess patient deterioration is the SOFA score (Sequential Organ Failure Assessment). Designed to evaluate the function of six key organ systems, the SOFA score helps quantify the extent of a patient’s organ dysfunction and predict their risk of mortality.
By calculating and tracking SOFA scores over time, I uncovered patterns that could be used to predict worsening conditions before they reached critical thresholds.
What the Data Revealed:
Rising SOFA scores correlated strongly with ICU admission and poor outcomes. A jump of 2 or more points over 24–48 hours often preceded critical deterioration.
Patients whose SOFA scores remained stable or improved had significantly higher survival rates—even if their initial scores were high.
Renal and respiratory systems were most commonly impaired early on, while liver and coagulation abnormalities emerged as late-stage indicators.
Visualizing Risk to Guide Decisions
To make SOFA data accessible and actionable, I created interactive visualizations that:
Tracked each organ’s individual score component over time
Showed cumulative SOFA scores with color-coded thresholds
Highlighted rapid score increases as alerts for clinicians
These dashboards allowed healthcare teams to:
Monitor organ systems in near real-time
Spot subtle shifts before they became clinically obvious
Escalate care (ICU transfers, mechanical support) at the right moment
The SOFA score is more than a number—it's a window into how the body is coping with infection. By integrating this into visual tools, we can support early intervention and resource prioritization in high-stakes environments like emergency rooms and ICUs.
In the context of sepsis, where each hour can mean the difference between life and death, having a clear, data-driven understanding of organ failure progression empowers clinicians to act faster and smarter.
Integrated Dashboard Suite
The final sprint focused on storytelling with data. I consolidated the analysis into an interactive dashboard suite in Tableau.
Highlights:
Patient overview: age, gender, admission details

SIRS and SOFA summaries
Organ-specific lab charts with trendlines
Sepsis progression timelines
ICU admission and mortality flags
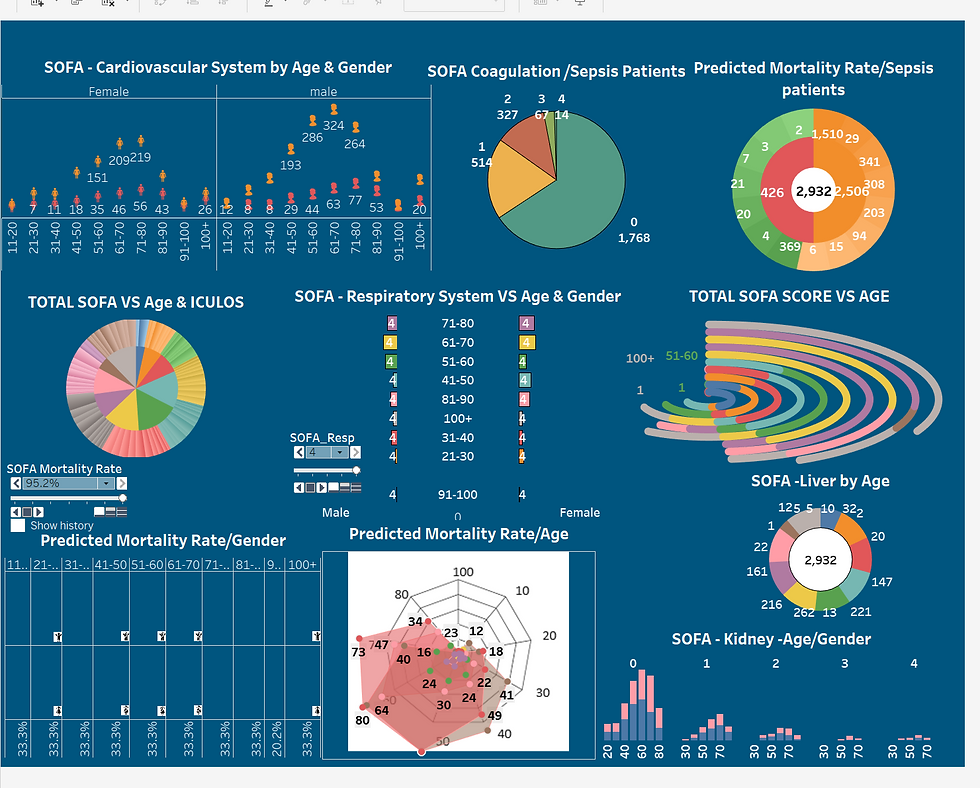
Building Interactive Dashboards for Clinician Use
To turn analysis into action, I designed a suite of dashboards using Tableau and Power BI. These visualizations included filters for demographics, organ-specific deterioration, SIRS flags, SOFA score trajectories, and time-to-shock transitions. The goal was to present complex patient data in a digestible, actionable format for clinicians and hospital staff.
These dashboards could be used to:
Monitor at-risk patients in real time
Flag critical trends before full organ failure
Support triage decisions and ICU referrals
Key Takeaways and Impact
Early detection is possible: SIRS and SOFA scores can predict deterioration before it becomes clinically obvious.
Organ systems behave differently: Some organs show stress early, others decline rapidly during septic shock.
Visualization is crucial: Real-time dashboards transform raw data into life-saving insights.
Data can drive intervention: By identifying risk patterns, hospitals can prioritize care and reduce mortality.
Final Thoughts
This project deepened my understanding of both clinical data and the power of applied analytics in critical care. Sepsis is a race against time, and data can be a powerful ally in that race.
By transforming raw hospital data into predictive insights and visual tools, we can support healthcare professionals in making faster, more informed decisions—potentially saving lives in the process.
If you're working at the intersection of healthcare and data or are interested in exploring these dashboards, feel free to reach out. I'm passionate about building solutions where analytics meet impact.


