Perform an EDA using YData Profiling

Updated: May 2, 2025
YData-profiling is a valuable tool in Python for Data profiling and Exploratory Data Analysis (EDA), provides comprehensive insights, generates detailed reports with statistics and visualizations.
What is Data Profiling?
Data profiling is the process of analyzing data sets to evaluate their quality, structure, and content. It identifies anomalies, missing values, and patterns, ensuring data accuracy and consistency. It finds hidden problems in the data before start building models.
Data profiling means carefully examining your dataset to understand
Any missing values in the dataset?
Verify that the data is in the correct format.
Check any duplicate records available?
Are there any extreme or nonsensical values in numeric columns?
Does the data follow expected patterns?
What is Exploratory Data Analysis (EDA)?
EDA is the initial exploration of the dataset — before you build models, make predictions, or doing deeper analysis.
EDA includes:
Getting basic statistics (mean, median, standard deviation, etc.)
Creating visualizations (histograms, scatter plots, box plots, heatmaps, etc.)
Finding missing data or weird entries
Checking correlations between variables
Identifying patterns or outliers that could impact your work
Why YData Profiling is important?
It finds hidden problems in the data before you start building models.
It helps you plan cleaning, transformations, and validations.
It can save you from disasters later when bad data ruins your project.
Generating Profile Report
To generate a profile report, follow the steps below:
Import pandas.
Import the ProfileReport class from the ydata_profiling library.
Create a DataFrame using your dataset.
Use the ProfileReport () class and pass the DataFrame.
It is a very simple code, import the necessary libraries and read the csv file. And generate the report. To display the report there are few ways to do it.
Render the full interactive report inline in the Jupiter notebook.
profile = ProfileReport (df, title="TreadMill Test Result", explorative=True)
profile
profile.to_notebook_iframe()
This explicit method will render the report in a contained, scrollable frame in the Jupiter output cell.
profile = ProfileReport (df, title="TreadMill Test Result", explorative=True)
profile.to_notebook_iframe()
Save the report for future analysis
To save the report for future use such as extracting useful data from the profile report or integrating it with other applications, the file can be saved as html or Json file. Here the method profile.to_file() will be same in html/json reports but file extension will be different (filename.html or filename.json)
· Html Report
profile = ProfileReport (df, title="TreadMill Test Result", explorative=True)
profile.to_file(Path("./physionet_treadmill_report.html"))
· Json Report
profile = ProfileReport(df, title="TreadMill Test Result", explorative=True)
profile.to_file(Path("./physionet_treadmill_report.json"))
Profiling Large Datasets
YData-Profiling summarizes the input dataset to provide the most insights for data analysis. For small datasets, these computations can be done quickly. But it is cumbersome for large datasets.
If the dataset is very large, doing only a quick check of data and has memory constraints, while generating ‘profile report’ use ‘minimal= True’.
Example
profile = ProfileReport (df, title="TreadMill ", explorative=True, minimal=True)
It disables some computations and visualizations to speed up report generation and reduce memory usage.
o Skips correlation matrix
o Disables missing value diagrams
o Disables sample rows display
o Skips individual variable visualization
Dataset Used:
Treadmill Maximal Exercise Tests from the Exercise Physiology and Human Performance Lab of the University of Malaga.
Install the package
If running ydata profiling package from Jupiter Note Book , use the below command to install this package.
!pip install ydata-profiling
Sample code:
import pandas as pd
from pathlib import Path
from ydata_profiling import ProfileReport
df = pd.read_csv("https://physionet.org/content/treadmill-exercise- cardioresp/1.0.1/test_measure.csv",on_bad_lines='skip' )
profile = ProfileReport(df, title="TreadMill Test Result", explorative=True, minimal=True)
profile.to_file(Path("./Physionet_treadmill_report.html"))
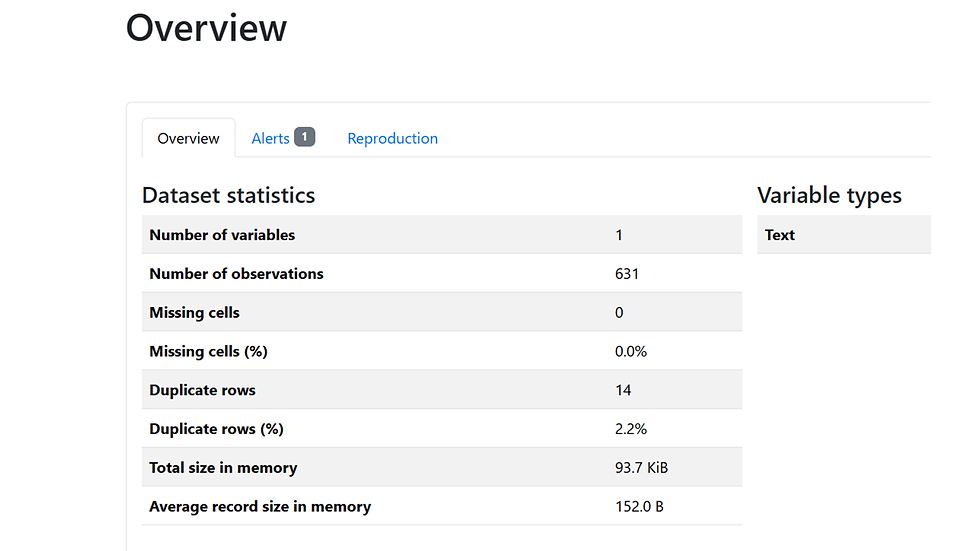
Physionet_treadmill_report.html will be generated as a output file and it contains all the information about the data like Dataset statistics, Variables, Missing Values, Duplicate Rows etc.,
Report Screen Shot:
Advantages
Ease of use: YData profiling is very easy to use. You only need to write a couple of lines of code to generate a comprehensive report.
Time-saving: YData profiling can create a comprehensive report with a wide range of information about a dataset with minimal effort. This makes it a great option for EDA.
Interactive HTML reports: YDate profiling generates interactive HTML reports that are easy to analyze and understand. The reports also allow you to dig deeper into specific variables and explore their distributions.
Comprehensive insights: report including a wide range of statistics and visualizations. The report is shareable as a html file.
Data quality assessment: excel at the identification of missing data, duplicate entries and outliers. These insights are essential for data cleaning and preparation, ensuring the reliability of your analysis and leading to early problems' identification.
Ease of integration with other flows: all metrics can be downloaded as a json file , it can be passed to other applications for any analysis
Data exploration for large datasets: even with dataset with a large number of rows, ydata-profiling will be able to help to do exploratory analysis on Pandas Dataframes
Additional Features:
Comparing Datasets:
YData-profiling can be used to compare multiple versions of the same dataset. This is useful when we create dataset profile for training, validation and test sets in machine learning.
Dataset description & Metadata:
When we publish a report, it is important to include metadata of the dataset, such as author, copyright holder or descriptions. YData profiling helps to generate a report with description, copy right year, copy right holder and creator, URL and also column-specific descriptions. Also, users can set the type_schema property to control the generated profiling data types.
Handling Sensitive Data:
Handling sensitive health care data like private health records should not be shared when you share the YData Profiling report.
report = df.profile_report(sensitive=True) , this will indicate to provide only the aggregate information in the report
report = df.profile_report(duplicates=None, samples=None), this will stop showing the sample and duplicate data in the report
Time Series Data:
YData Profiling can be used for a quick Exploratory Data Analysis on time-series data. This helps to understand the time dependent variables such as time plots, seasonality and trends.
YData Profiling Documentation


