Part1: Beyond the CSV: Engineering Custom Datasets with Python
- jagarapujeevani
- Jan 13
- 5 min read

Introduction: Challenging the Traditional Analytics Workflow
Usually, the roadmap for building a data portfolio follows a very specific, linear path. The formula is familiar to almost everyone entering the field:
Find a pre-cleaned dataset on a portal like Kaggle.
Download the static CSV file.
Clean any minor remaining errors using Excel, SQL or Power BI.
Visualize the results in a standard dashboard.
It’s a safe and effective process for learning the basics. However, as I began to dig deeper into the field, I found myself asking a critical question: What happens if the data I need doesn't exist in a file yet?
In a professional environment, data doesn't just "appear" as a neat file on your desktop. It is often unstructured, messy, and scattered across the live web. I realized that by only working with pre-packaged datasets, I was practicing in a "sandbox". I was mastering the art of the chart, but I was missing a vital skill of a modern Data Architect: The Hunt.
I decided to break this mold. Instead of downloading a file, I thought: "Why not build the pipeline myself? Why not go directly to the source, navigate the technical barriers of the live web, and engineer a custom dataset from scratch?" This blog documents that shift—moving from a consumer of static data to a producer of live, engineered assets.
The "Why": Choosing Logic Over Convenience
As an aspiring analyst, it would have been easier to stay within the familiar boundaries of databases. However, I chose to build a custom Python web scraper for the "Highest-Grossing Films" from Wikipedia for three strategic reasons:
Demonstrating End-to-End Proficiency: Most portfolios show "Clean -> Visualize". By starting with a raw URL, I am demonstrating Data Acquisition—the ability to find a source and build the "plumbing" to extract it.
Overcoming the "Static Data" Constraint: Static files are a snapshot of the past. By engineering a scraper, I’ve built a living data product that can be re-run at any time to capture the most current 2026 box-office records.
Mastering Engineering Logic: Working directly in a Jupyter Notebook with Python forced me to confront the underlying logic of HTTP protocols, Access Levels, and Data Governance.
The Learning Curve: A Growth Mindset
One of the most rewarding parts of this project was the shift in my mindset. When you download a CSV, the columns are already defined for you. When you scrape the web, you have to define the schema yourself. This required me to learn about HTML tags, Status Codes, and Data Validation. While intimidating at first, it taught me more about the "DNA" of data than any pre-made spreadsheet ever could.
The Technical Journey: A 3-Step Extraction
Step 1: The Ethical Audit (Access Levels)
A professional engineer never scrapes blindly. My first step was an audit of the robots.txt file. This file acts as a site's "Access Level" gatekeeper, dictating what automated scripts are permitted to do. My audit revealed that the server requires identification via a User-Agent header to grant access to its data.

Step 2: Authenticating the Connection
To respect the server’s security and governance, I engineered a request that included a custom header. This authenticates the script as a legitimate browser session rather than an anonymous bot.
The Result: I achieved a Status Code: 200, the universal signal for a successful and authorized connection to a web server.

Step 3: From HTML to DataFrame
Using the Pandas library, I utilized the read_html function to parse the raw web code. This function scans the webpage for specific HTML tags and instantly converts them into a structured format called a DataFrame. In one line of code, I transformed chaotic web text into an organized table ready for export.


Data Quality and Validation: Ensuring Integrity
Extraction is only half the battle. Once the data was in Python, I had to perform Data Validation. Web data is notoriously unstructured; for instance, Wikipedia’s "Worldwide gross" column contained a mix of currency symbols, commas, and footnote references like [1].
To maintain high data integrity, I engineered a cleaning script using Regular Expressions (Regex) to strip non-numeric noise. I then implemented a validation check that identified 6 rows of invalid data that did not meet the numerical schema. Rather than allowing "garbage data" to corrupt my final analysis, I programmatically dropped these rows, ensuring that my exported highest_grossing_movies_CLEANED.csv is a high-quality, reliable asset for statistical modeling.


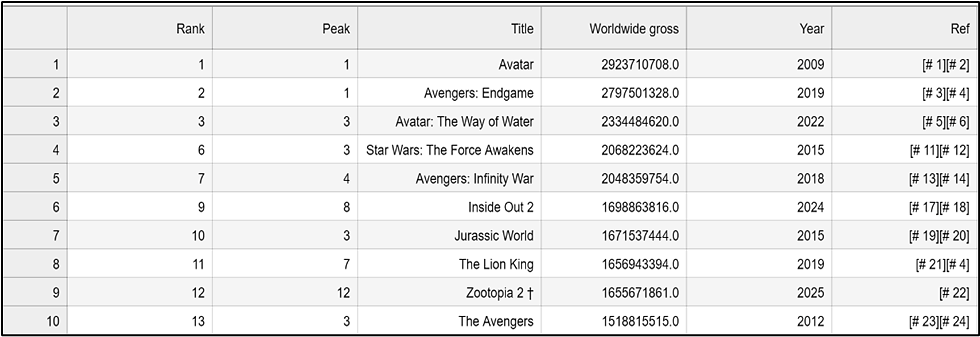
Tranformations:
Numerical Conversion: Notice the Worldwide gross column. By stripping the currency symbols and citation brackets, I’ve converted strings like "$2,923,710,708 [# 1]" into clean floats like 2923710708.0. This is the difference between a "pretty table" and a dataset that can power complex statistical models.
Schema Enforcement: I’ve standardized the Year column to a 4-digit integer format. This ensures that any time-series analysis in the next phase will be accurate, without citation noise or formatting errors disrupting the timeline.
Preserving Data Lineage: While I cleaned the primary analysis columns, I strategically preserved the original Ref column. In a professional environment, this maintains "Data Lineage," allowing an analyst to trace any specific data point back to its original Wikipedia source if a discrepancy is found.
Technical Scalability: Beyond a Single Table
A major advantage of leveraging Python over manual data collection methods is Scalability. While this project focused on extracting one specific Wikipedia table, the architecture I’ve built is intentionally modular. In a professional business context, this script could be easily expanded into a Loop.
Instead of targeting a single URL, I could provide a list of hundreds of movie-related pages. The script would then visit each one, handle the authentication headers, validate the data, and append the results to a master "Big Data" file automatically. It allows for the creation of massive, high-velocity datasets that would be impossible to compile by hand, providing a significant competitive advantage in any data-driven industry.
Conclusion
By the end of this engineering phase, I successfully exported my live scrape into a permanent highest_grossing_movies.csv file. I have moved from being a mere consumer of data to a 'Data Architect' 😊.
What’s Next?
Building a clean CSV was only the first step. With the data noise removed, I’m ready to dive into the Statistical Analysis phase. Stay tuned for Part 2, where I'll use Python’s Seaborn and Matplotlib libraries to visualize the distribution of global wealth in cinema and reveal the underlying trends that a raw spreadsheet can't show you 😊
References & Technical Documentation
Primary Data Source: Wikipedia, List of highest-grossing films (Accessed January 2026). Data was extracted live to demonstrate real-time data acquisition.
Pandas Documentation: Official documentation for parsing HTML tables into DataFrame objects. Available at: Pandas read_html Docs
Python Requests Library: Documentation for managing HTTP/1.1 requests, custom headers, and session authentication. Available at: Requests: HTTP for Humans
Ethical Web Scraping Standards: The robots.txt Exclusion Protocol. Applied to ensure compliance with Wikipedia's crawler permissions and server governance.
Data Integrity Principles: Documentation on Regular Expressions (Regex) for string sanitation and data validation within the ETL pipeline.


