Pareto chart in Tableau
Pareto Chart
As the name suggests the chart gets its name since it uses the Pareto Principle.
Pareto Principle: The Pareto Principle, also known as the “80/20” rule, states that for many events, roughly 80% of effects come from 20% of the causes. It is a great tool for productivity and business management.

Pareto Charts serve as a key tool in quality control and continuous improvement efforts.
Uses: This visual tool, underpinned by the Pareto Principle, helps pinpoint the critical factors that contribute most significantly to a problem. It transforms complex datasets into actionable insights, ensuring that effort and resources are focused where they can have the most substantial impact. This guide dives into the essence of Pareto Charts, their composition, and how they apply the Pareto Principle to foster strategic improvements across diverse industries.
Key Components of a Pareto Chart
Bars: Bars Represent category with height as sum of sales
Line Graph: Superimposed on the bar chart is a line graph that displays the cumulative total sales as you move from left to right.
Let’s See steps for Pareto chart in Tableau.
Step 1: select sales to rows and subcategories to column
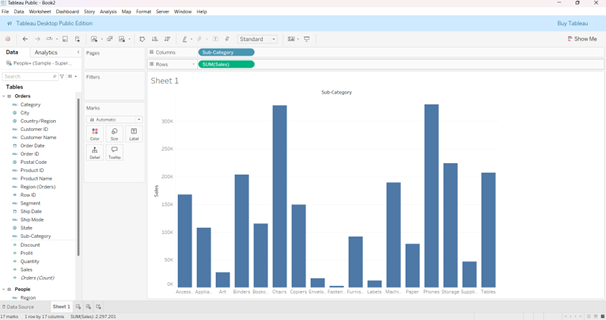
Step 2: Duplicate the sum(sales) in rows so that we can see two bar charts

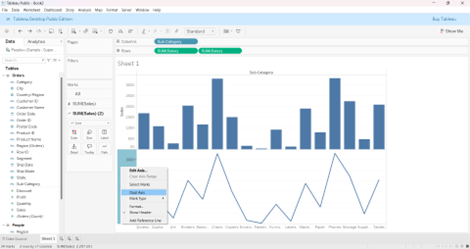
Step 3: Select line chart option under marks for duplicated sum(sales)

Step 4: Convert them into dual axis chart
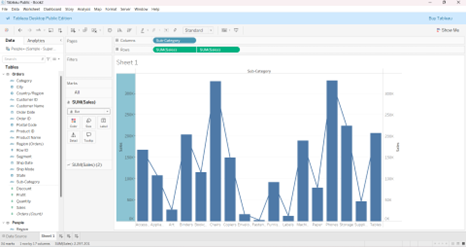
Step 5: Sort in descending order
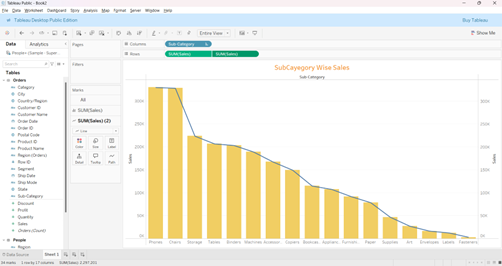
Step 6: Select add table calculations And select running total from drop down.
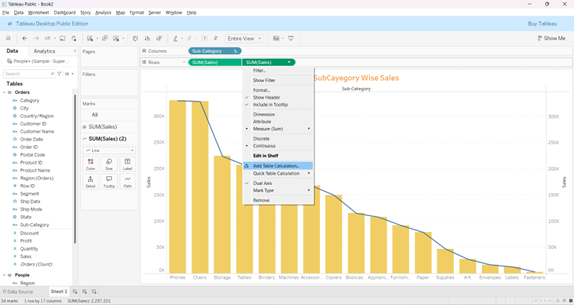
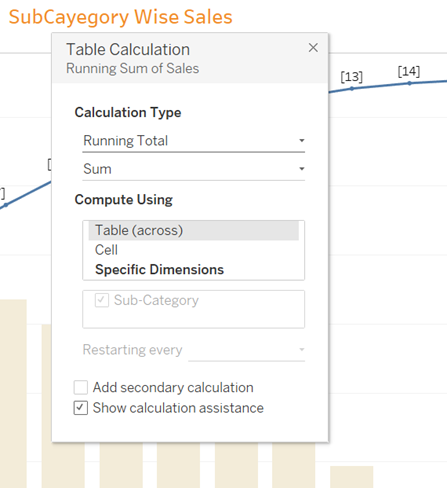
Step 7: Add Labels to sum and running sum under marks.
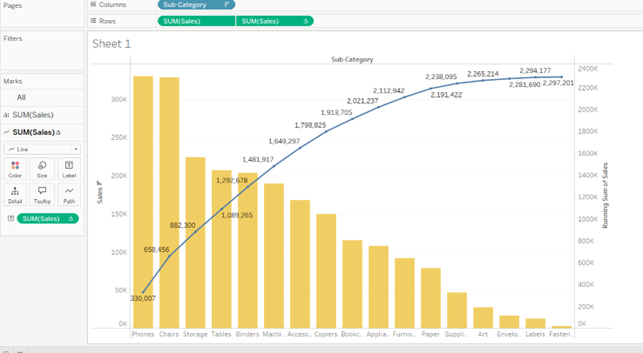
Format numbers to remove overlapping and easy understanding
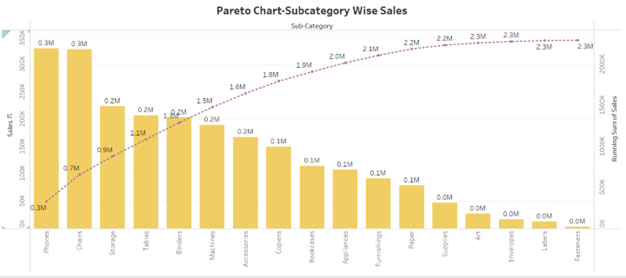
Insights from the Chart:
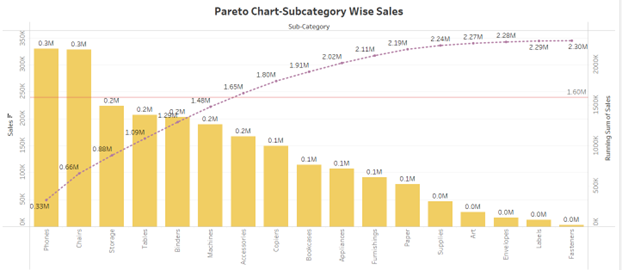
Sales Frequencies: The distribution starts with ‘Phones’ as the most sales, followed by ‘Chairs.
80% Threshold: The red dashed line indicates Phones and chairs are the two products that theoretically contribute to 80% of the Sales


