Mastering Power BI Schemas for Better Dashboards

When people start using Power BI, they usually jump directly into creating charts and dashboards. But before making any visuals, the most important step is organizing your data correctly. The arrangement of your data is called a schema.
Schemas decide everything:
✔ how fast your dashboard loads
✔ how accurate your numbers are
✔ how clean your relationships look
✔ how easy your formulas become
Think of a schema like the foundation of a house. If the foundation is strong, the house stands firm. If it is weak, everything falls apart. Similarly, if your Power BI schema is clean, your entire report becomes fast, smooth, and reliable.
What Is a Schema in Power BI?
A schema simply explains how your data model is arranged. It shows:
What tables you have
What columns are inside those tables
How tables connect to each other
What type of relationships exist
How filters and calculations should move
You can think of a schema as a map for Power BI.Without this map, Power BI cannot understand how your data should work together.
Why Are Schemas Important?
Many beginners ignore schema design and later face problems like wrong totals, slow visuals, or filters not working properly. A good schema prevents all that.
1. Faster Dashboards
A clean schema reduces unnecessary processing, so visuals load instantly.
2. Correct Results
Totals, averages, year-wise comparisons—all depend on correct relationships.
3. Simpler DAX Formulas
Instead of writing long and confusing formulas, you can use short and clean DAX.
4. No Relationship Errors
No loops, no confusing many-to-many issues, and no wrong filters.
5. Easy to Maintain
If your data increases or new columns are added, a well-planned schema adjusts smoothly.
Types of Schemas in Power BI
Power BI mainly uses three schema designs. Each one affects speed and clarity differently.
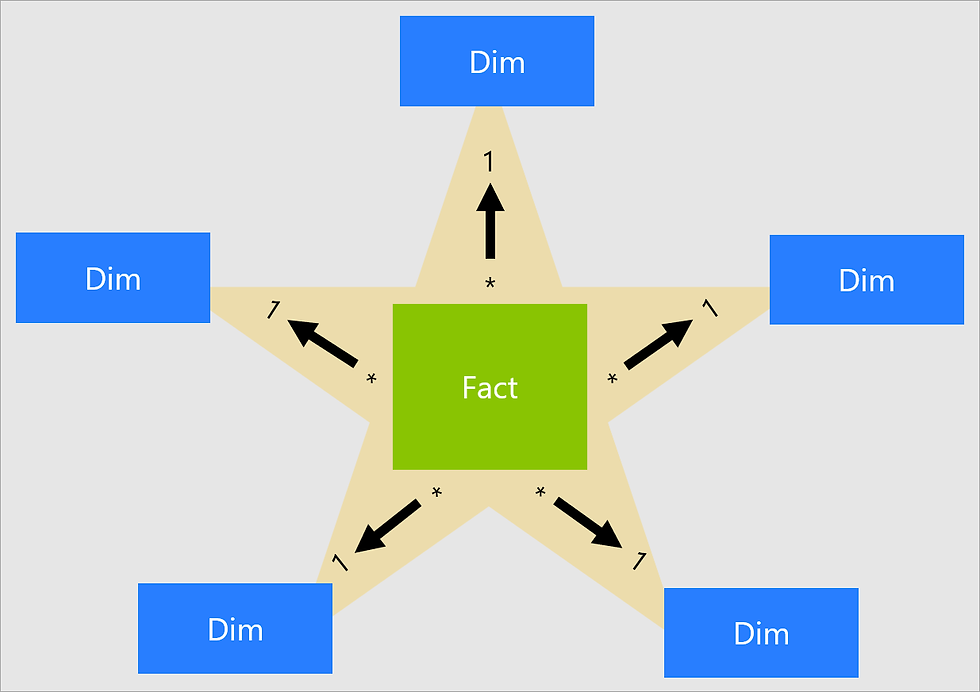
1. Star Schema (Most Recommended)
This is the best and simplest schema for Power BI.
It has:
One fact table → contains numbers (sales, marks, revenue, attendance)
Multiple dimension tables → contain descriptions (students, batches, dates, courses)
Why it’s called a star?Because the fact table is in the center and dimension tables surround it like star points.
Example:
Fact Table: Attendance Fact → Student ID, Batch ID, Date, Present/Absent
Dimension Tables: Students, Batches, Courses, Dates
Power BI performs best with star schema.
2. Snowflake Schema
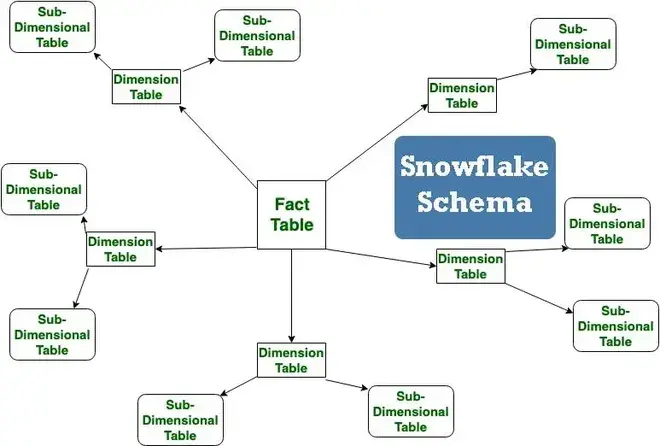
This is an extended form of star schema. Dimension tables are further broken into smaller tables.
Example: flat schemaInstead of one Students table, you have:
Students
Districts
Countries
This makes data cleaner but slightly slower. Used mainly when data is very structured.
3. Flat Schema (Not ideal for Power BI)
Everything sits in one big table. Example: student name, batch, course, trainer, attendance, date—all in one place.
It is easy for beginners but becomes:
slow,
large in size,
difficult to calculate,
hard to filter.
Not recommended for professional dashboards.
Important Parts of a Schema:
To understand schemas, you must know the main building blocks:
✔ Tables
These hold the actual data (like Students, Batches, Attendance).
✔ Columns
Fields inside tables (StudentName, BatchID).
✔ Data Types
Power BI needs correct data types such as number, text, and date.
✔ Keys
Used to connect tables.
Primary Key → unique values
Foreign Key → links to another table
✔ Relationships
Power BI links tables using:
One-to-Many
Many-to-One
One-to-One
Star schema mostly uses One-to-Many, which keeps things simple.
How Schemas Improve Dashboards
A good schema affects every part of your report:
✔ Dashboards load faster
✔ Slicers filter correctly
✔ Totals are accurate
✔ DAX is easier
✔ Data model stays cleaner
✔ Visuals become more reliable
✔ Reports work smoothly even with millions of rows
Schema decides the health of your report.
Real-Life Example (Easy to Understand)
Suppose you are building a Student Attendance Dashboard.
❌ WRONG WAY: One Big Table
Put everything together:
StudentName | BatchName | Trainer | Course | Date | Attendance
Problems:
Data repeats
File becomes heavy
Filters don’t behave correctly
Calculations become messy
Report becomes slow
✔ RIGHT WAY: Star Schema
Build one fact table and multiple dimension tables.
Fact Table:AttendanceFact (StudentID, BatchID, Date, Present/Absent)
Dimension Tables:StudentsBatchesCoursesDates
Benefits:
Clean model
Fast visuals
Easy reporting
Accurate numbers
Simple formulas
This is why schema design matters so much.
How to Identify a Good Schema
Your data model is good if it has:
One central fact table
Multiple dimension tables
A proper date table
Simple one-to-many relationships
No loops or many-to-many links
Clear column names
A clean diagram view
If your model view looks neat and easy to read, your schema is correct.
Final Summary
Schemas are the heart of your Power BI reports. A clean schema means fast dashboards, accurate calculations, and smooth filtering. Among all schema types, the star schema is the best choice for most projects.
Whether you’re building dashboards for students, sales, HR, finance, or attendance, a good schema will make your Power BI work feel easier and more professional.
If you get the schema right, everything else in Power BI becomes simple.


