Mastering DAX Basics: The Most Useful Functions for Analysts
- seva7vairavan
- Aug 6
- 5 min read
What is DAX in Power BI:
The Data Analysis Expressions (DAX) is a formula language in Power BI used for the creation of custom calculations and aggregations. It helps users to effectively analyze and manipulate data within Power BI reports.
Why is DAX essential for Power BI analysts?
Enhanced Data Analysis: DAX enables analysts to define custom calculations beyond basic aggregations available in Power BI. This flexibility helps derive deeper insights, generate new metrics and key performance indicators (KPIs), and tailor analysis to specific business needs.
Custom Metrics and KPIs: With DAX, analysts can create custom measures that respond dynamically to user interactions and filters applied within Power BI reports. These measures are crucial for tracking key performance indicators and presenting a customized view of data.
Time Intelligence Functions: DAX provides a specialized set of functions for analyzing and comparing data across different time periods, including year-to-date, quarter-to-date, month-to-date, and rolling averages. These functions are essential for trend analysis and forecasting.
Calculated Columns: DAX enables the creation of calculated columns within tables, adding new data elements derived from existing data through custom formulas. These columns are useful for tasks like categorizing data, creating custom identifiers, or performing row-by-row calculations.
Flexibility and Efficiency: DAX offers a powerful and flexible syntax, allowing analysts to craft complex formulas for varied data manipulation and analysis requirements. It helps optimize calculations for performance and readability within the data model.
Dynamic and Interactive Reports: DAX integrates seamlessly with Power BI visualizations, enabling analysts to create dynamic and interactive reports and dashboards where calculations automatically update based on user selections and filters.
Easier Learning Curve: For those familiar with Excel formulas, the DAX syntax is relatively easy to learn, making it accessible to a wide range of business users and data professionals.
Consistent Reporting: DAX formulas, once defined, can be reused across multiple reports, ensuring consistency in calculations and metrics across an organization's Power BI environment.
In essence, DAX empowers Power BI analysts to move beyond basic data visualization and delve into sophisticated data analysis, creating customized insights and reports tailored to specific business requirements.
Top DAX Functions Every Analyst Should Know:
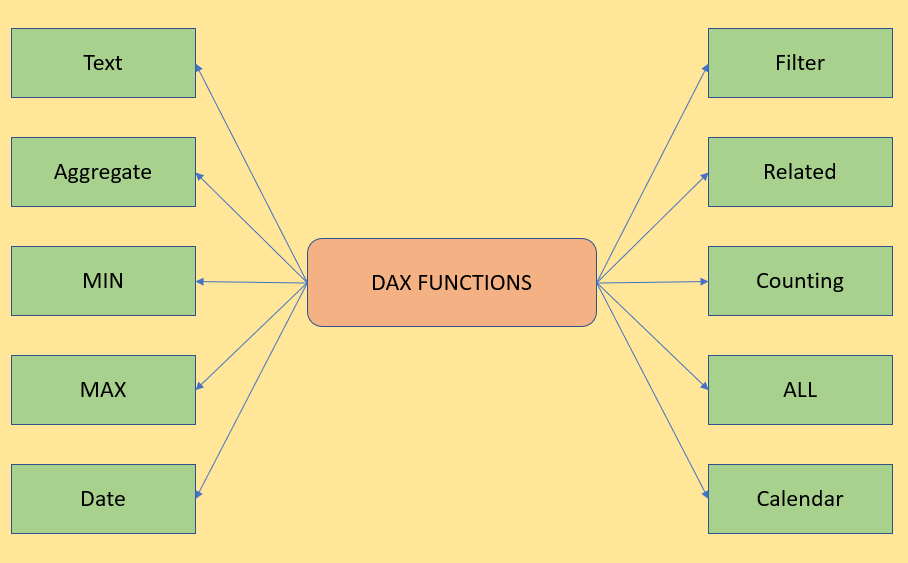
1. Text
Functions and columns containing text/string data.
Example:
New Column = [FirstName] & " " & [LastName]
Explanation:
This creates a new column "New Column" by joining the "FirstName" and "LastName" columns with a space in between.
2. Aggregate
Refers to functions that summarize data, like SUM, MIN, MAX, COUNT. They combine multiple values into a single value.
SUM:
In Power BI, the DAX SUM function is used to calculate the sum of values in a single column.
Example:
Total Sales = SUM(Sales[SalesAmount])
Explanation:
Total Sales: This is the name of the new measure you are creating.
SUM: This is the DAX function that calculates the sum.
Sales[SalesAmount]: This specifies the column you want to sum. Sales is the table name, and SalesAmount is the column within that table.
3. MIN
Returns the smallest value in a column or between expressions.
Example:
Minimum Sales = MIN(Sales[SalesAmount])
Explanation:
This measure would return a single value representing the smallest sales amount recorded in your Sales table.
4. MAX
Returns the Largest value in a column or between expressions.
Example:
Max Sales Amount = MAX(Sales[SalesAmount])
Explanation:
Max Sales Amount is the name of the new measure.
MAX() is the DAX function to find the maximum value.
Sales[SalesAmount] refers to the 'SalesAmount' column within the 'Sales' table.
5. Date
Refers to date/time data types and functions used for time intelligence in Power BI.
Example:
CurrentDate = TODAY()
Explanation: Returns the current system date
YearOfOrder = YEAR('Table'[OrderDate])
Explanation: Extracts the year from a date.
MonthOfOrder = MONTH('Table'[OrderDate])
Explanation: Extracts the monthfrom a date.
DayOfOrder = DAY('Table'[OrderDate])
Explanation: Extracts the Day from a date.
Calculating the Difference Between Two Dates:
Example:
DaysSinceTransaction = DATEDIFF('Table'[TransactionDate], TODAY(), DAY)
Explanation:
This calculates the difference in a specified interval (e.g., days, months, years) between two dates.
6. FILTER
The FILTER function is a table function that returns a table filtered by a specified condition.
Example:
Sales_2023 =
FILTER(
'Sales',
YEAR('Sales'[OrderDate]) = 2023
)
Explanation:
This formula creates a new table named Sales_2023 containing only the rows from the Sales table where the OrderDate falls within the year 2023.
7. RELATED
Retrieves a related value from another table via an existing relationship.
Example:
ProductName = RELATED(Products[ProductName])
Explanation:
ProductName is the name of the new calculated column.
RELATED is the DAX function.
Products[ProductName] specifies the column from the related Products table that you want to retrieve.
8. COUNT
Counts the number of rows containing numbers or non-blank values in a column.
COUNT:This function counts the number of rows in a column that contain numeric values, dates, or strings. It excludes blank values.
Example:
Count_of_Sales_Quantities = COUNT(Sales[OrderQuantity])
COUNTA: This function counts the number of rows in a column that contain any non-blank value, including text, numbers, or logical values.
Example:
Count_of_Product_Categories = COUNTA(Product[Category])
COUNTBLANK: This function specifically counts the number of blank cells in a column.
Example:
Count_of_Blank_Order_Dates = COUNTBLANK(Orders[OrderDate])
COUNTROWS: This function counts the number of rows in a specified table or a table expression. It is often used with CALCULATE or FILTER to count rows based on specific conditions.
Example:
Total_Number_of_Orders = COUNTROWS(Orders)
9. ALL
Removes filters from specified columns or tables, useful for calculating totals or percentages ignoring filters.
Example:
Total Sales (All Categories) = CALCULATE(
SUM(Sales[SalesAmount]),
ALL(Sales[ProductCategory])
)
Explanation:
CALCULATE(SUM(Sales[SalesAmount]), ...):
This part initiates a calculation of the sum of SalesAmount from the Sales table.
ALL(Sales[ProductCategory]):
This is the core of the ALL function in this example. It instructs Power BI to remove any filters applied to the ProductCategory column within the Sales table. This means that even if a slicer is used to filter for "Electronics," the Total Sales (All Categories) measure will still display the sum of sales for all product categories.
10. Calendar
A date table used to support time intelligence functions.
Example:
Dates = CALENDAR(DATE(2020, 1, 1), DATE(2025, 12, 31))
Explanation:
Create a table named Dates with dates from January 1, 2020, to December 31, 2025
How These Functions Improve Reporting
These essential DAX functions empower analysts to create dynamic, context-aware measures that respond instantly to user interactions like slicers and filters. This flexibility allows reports to display accurate, real-time insights tailored to the current view.
By leveraging these functions, you can build insightful KPIs and trend analyses that reveal meaningful patterns—such as sales growth over time or profit margins by product category—helping decision-makers understand business performance at a glance.
Additionally, these functions enable customized filtering and aggregation, giving you full control to calculate complex business logic, compare across different segments, and highlight key insights without manual data preparation.
Conclusion
Learning these basic DAX functions unlocks Power BI’s true potential. Practicing and combining them helps create smarter, more dynamic reports that solve real business problems.


