LOD Expressions In Tableau: The Hidden Analytical Tool Behind Advanced BI

Updated: Jun 5
Introduction: What is LOD and why is it more powerful than most users realize?
Most tableau users learn the different types of charts, filters and a little bit of calculated fields. But beneath the surface, tableau has a feature that makes it a mini analytical engine. It is called the LOD.
Level Of Detail(LOD) is a feature in tableau which let's you control how the data is aggregated in a visualization, independent of what's currently shown in the view.
What that means?
Normally, tableau aggregates data based on your dimensions in your worksheet (region, sales, category etc) But sometimes you need the data in different level of granularity. That's where we use the LOD.
In many modern analytics architectures, LOD acts as a bridge between SQL logic and visual analytics, reducing the need for upstream transformation layers.
The Core Idea : Tableau has "Multiple Levels of Truth"
In traditional BI systems the aggregation happens in the system.
SELECT region, SUM(sales)
FROM orders
GROUP BY region;
But In Tableau, the calculations are defined in a different level of detail regardless of the visualization.
There are three different kinds of Level Of Detail:
1. FIXED - Locks calculations to specific granularity.
2. INCLUDE - Adds detail to the current view.
3. EXCLUDE - Removes details from the current view.
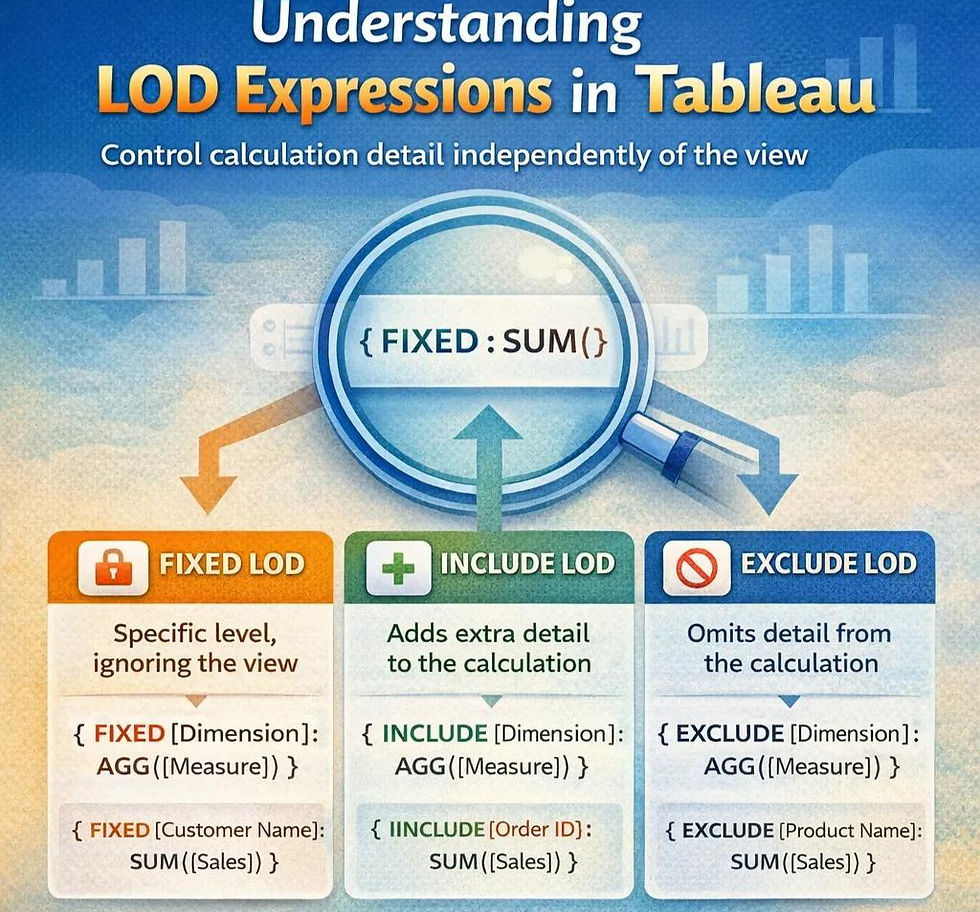
In this blog, I have used the dataset Sample-Superstore to understand the used of the above mentioned LOD expressions.
- FIXED LOD - Creating independent analytical layers
This is the most important and widely used LODs. It defines calculations at a constant level of granularity.
Example:
Suppose our view contains Region and Sales. But we want to show the Region-wise total sales. So we created the calculated field Region wise Sales.
{ FIXED [Region] : SUM([sales]) }

By using FIXED LOD we lock the calculation at Region level no matter what is in the view.
No matter you add category or state, sales will always be calculated based on region only.
- INCLUDE LOD - Adding micro-details to the aggregated views
It takes you one level deeper than the current visualization.INCLUDE LOD enables
multi-granularity blending inside a single visualization without duplicating datasets.
Example:
Suppose we want to understand what is the average total sales amount per customer within each region.
{ INCLUDE [Customer Name] : SUM([Sales]) }

Here we can see that the region wise sales is mentioned. At the same time the average of total sales per customer from each region is also shown.
-EXCLUDE LOD - Removing noise from aggregation
EXCLUDE does the opposite of INCLUDE. Removes dimensions from the calculations even if they exists in the view. Removes unwanted details.
Example: Suppose your view contains Category and Sub-Category, and you want to calculate the total sales at the higher Category level so you can find what percentage of revenue each sub-category contributes. Let's create a calculated field named Category Total.
{ EXCLUDE [Sub-Category] : SUM([Sales]) }

What makes LOD fundamentally different from SQL?
LOD looks like SQL GROUP BY logic at first glance. But it is not. There is a deeper difference.
SQL Model | Tableau LOD Model |
Single Aggregation Path | Multiple Simultaneous Aggregation Levels |
Fixed Query Structure | Independent of visualization structure |
One level of grouping per query | Reusable across contexts |
Instead of forcing data into one aggregation shape, Tableau allows multiple coexisting “truth layers.”
Performance Considerations for LOD Expressions
Although LOD is very powerful, they should be used strategically.
Larger datasets can induce performance challenges when calculations becomes over complex.
Potential Performance Risks
Increased database query complexity
Longer dashboard load times
Higher cloud warehouse compute costs
Additional processing overhead
To optimize dashboard performance, there are some best practices-
Use extracts when appropriate
Minimize unnecessary nested calculations
Push heavy transformations upstream when possible
Test performance with realistic data volumes
Standardize frequently used calculations
Organizations that balance flexibility with performance often achieve the best long-term results.
Real- world Applications of LOD Expressions
Used In Customer Analytics
Example: Customer Lifetime Value(CLV)
Business Problem : Calculate total spending per customer
Solution : { FIXED [Customer Id] : SUM([Sales]) }
Example: Identifying repeat customers
Business Problem: Recognize regular customers
Solution : { FIXED [Customer Id] : COUNTD([Order ID]) }
Used In Retail Intelligence
Example: Identify the VIP customer
Business Problem : Which customer spends $5,000 annually?
Solution : { FIXED [Customer Id] : SUM([Sales]) }
This helps us in giving specialized promotions to the customer and keeping them happy.
Financial Reporting
Example: Department Revenue/Expense Reporting
Business Problem: What is the revenue/expense in a particular department?
Solution :{ FIXED [Department] : SUM([Expense Amount]) } (Used to calculate the Expense/Department)
These use cases demonstrate why LOD expressions is considered one of Tableau’s most valuable advanced analytics capabilities.
The Future Of Tableau Analytics
In an era where data-driven decision making is very essential, LOD expression increases the reliability and sophistication of tableau reporting . LOD expression make tableau a very powerful tool in business intelligence.
Whether you're building customer analytics dashboards, financial reporting systems or enterprise KPI frameworks, understanding FIXED, INCLUDE and EXCLUDE expressions can transform how insights are generated and communicated.
For tableau professionals who wish to learn beyond the basic reporting, mastering the use of LOD expressions can add more value to modern day business intelligence .


