How to Install Streamlit in Anaconda Navigator and Build a Simple Python Dashboard
- Subasini Clattus
- Sep 2
- 4 min read
If you are looking for quick and easy way to build interactive dashboard using python -Streamlit is a great tool to start with. In this blog, I will share how to install Streamlit in Anaconda, create a basic dashboard and run your Streamlit app.
What is Anaconda?
Anaconda is free, open-source software to work with python, R and other languages. It gives full toolkit that is needed for coding, data and AI work.
Installing Anaconda
Go to the official website https://www.anaconda.com/download
Download the version based on you operating system
Run the installer
After installation, open Anaconda Navigator from start menu.
What is Streamlit?
Streamlit is an open-source Python library that helps you to build interactive, data driven dashboards/ web apps. The best part of Streamlit is, if you can write python then you build a Streamlit app easily.
Method 1 : Installing Streamlit in Anaconda Navigator
Step 1: Using the Environment
Open Anaconda Navigator
Navigate to environment
Click on the Environment tab in the left sidebar
You will see the current environment (e.g. base(root))

Click on the create button which is at the bottom of the environment bar
Create new environment dialog box will open.
Give name for the environment (e.g. streamlit_env) and choose python
Click create. New environment(streamlit_env) is created, and it will be displayed in environment tab

Choose the streamlit environment.
Change the dropdown from Installed to Uninstalled
In the search box, type streamlit
Check the box next to streamlit
Click Apply
Install Package dialog box will Open, click apply

Step 2: Setting up the Environment
In Anaconda Navigator -> Home, choose the streamlit environment (which you created)
List of all applications will be displayed
Install/ launch the VS Code
VS Code - It is a free , powerful code editor made by Microsoft. It helps to write code in many languages, use extensions like Python, Git, Streamlit
It will be redirected to VS Code application

Step 3: Creating Streamlit dashboard
In VS Code, new file will be opened. The file should be named as filename.py
In view tab, click on terminal.

Once it is opened, install the necessary package
(e.g) pip install streamlit pandas numpy matplotlib plotly seaborn
Create a simple dashboard.
Sample Python Dashboard

import streamlit as st
import pandas as pd
import numpy as np

# Page Configuration
st.set_page_config(
    page_title="Sales Dashboard",
    layout="wide"
)
# Dashboard Title
st.title(" Simple Sales Dashboard")

# Sidebar filters
st.sidebar.header("Dashboard Controls")

# Number of months slider
months = st.sidebar.slider("Number of months", min_value=3, max_value=12, value=6)

# Generate sample data
data = pd.DataFrame({
    'Month': [f'Month {i+1}' for i in range(months)],
    'Sales': (np.random.randint(10000, 30000, months) * sales_factor).astype(int),
    'Customers': np.random.randint(100, 500, months),
    'Revenue': (np.random.randint(50000, 150000, months) * sales_factor).astype(int)
})

# KPI Metrics
col1, col2, col3 = st.columns(3)

with col1:
    total_sales = data['Sales'].sum()
    st.metric("Total Sales", f"${total_sales:,}")

with col2:
    total_customers = data['Customers'].sum()
    st.metric("Total Customers", f"{total_customers:,}")

with col3:
    avg_revenue = data['Revenue'].mean()
    st.metric("Avg Revenue", f"${avg_revenue:,.0f}")

# Charts
col1, col2 = st.columns(2)

with col1:
    # Bar chart
    st.subheader("Sales by Month")
    st.bar_chart(data.set_index('Month')['Sales'])

with col2:
    # Line chart
    st.subheader("Revenue Trend")
    st.line_chart(data.set_index('Month')['Revenue'])

# Data table
st.subheader("Data Summary")
st.dataframe(data, use_container_width=True)
I will explain this Streamlit code by breaking down each functionality.
Importing Libraries
streamlit – It is the core framework for building dashboard/web apps.
pandas – For data manipulation and creating dataframes.
numpy – For generating random numbers and numerical operations
Creating Page Configuration
st.set_page_config() : It allows to configure and customize the browser tab appearance and page layout
Creating the Dashboard title
St.title() – it creates a large heading at the top of the dashboard.
Creating sidebar filter
st.sidebar.header() – It creates header at the left side of the table
st.sidebar.slider() – It creates a slider widget. It acts as a filter. Once the slider moves, the dashboard automatically reruns and update accordingly.
Creating layout with columns
st.columns(2)- It creates two equal width columns. It creates a side-by-side layout.
st.markdown() - It displays formatted text.
Step 4 : Run Streamlit App
Navigate to View ->click on Terminal
Terminal will be displayed
Now enter streamlit run filename.py
It will launch a browser window that displays the dashboard.

Method 2 : Installing Streamlit Using Anaconda Prompt
Step 1 : Open Anaconda Prompt
Click on windows -> Search for Anaconda Prompt and open it
Anaconda Prompt will be opened
Step 2 : Create a New Environment
Paste the below code and run for creating new environment. Change streamlit-env with any name.
Press Y to proceed
conda create --name stream_env python=3.9Step 3 : Activate the Environment
conda activate stream_envStep 4 : Install Streamlit
pip install streamlitStep 5 : Check the installation
Run this command to check if Streamlit works
It will launch a sample Streamlit app in browser
streamlit hello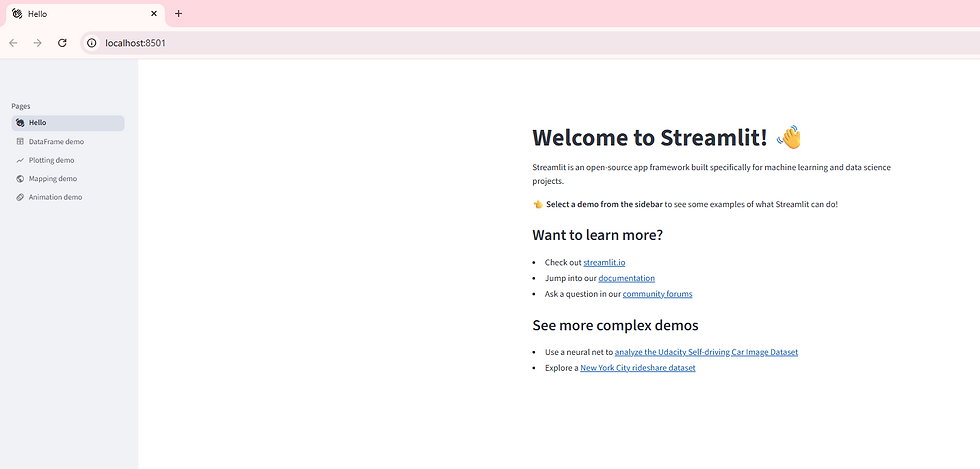
Step 6 : Create a simple dashboard
Open any text editor ( e.g. Notepad ++ ) and write the code.
Save the file as filename.py
Now in Anaconda Prompt, Navigate to the folder where the code is saved.
Run the code. It will launch the dashboard
Streamlit run filename.pyConclusion
Using Streamlit with Anaconda Navigator creates a powerful dashboard which is user friendly. Anaconda Navigator makes easy to manage environment and packages, while Streamlit allows us to focus on data and insights rather than web development complexity.


