How to Dynamically Change Number Units Between K/M/B In Tableau
- GAURI Mahindrakar
- Sep 2
- 4 min read

Hello Readers,
Before we begin with How to Dynamically Change Number Units, let's get refreshed with basic
🔳 What is Tableau?
Tableau is a powerful
Data Visualization
Business Intelligence tool
Help people to see and understand the data.
It allows you to connect to various data source
Databases
File
Which helps to create
Interactive Visualizations
Charts
Dashboards
With Tableau, you can explore and analyze data, identify patterns and gain insights to make data-driven decisions.
It simplifies the process of turning raw data into meaningful visual representations.
Tableau Public is a free version of tableau that has almost all of the same capabilities as Tableau Desktop.
In this blog you can see how to automatically change number formatting in Tableau between no units for values less than one thousand, K for thousands, M for millions and B for billions. Number display units are a great way to clean up visualization labels.
The issue is that number formatting is all or nothing per measure, so if you set the formatting to display units of K for thousands but then have a value of one hundred, Tableau will display 0K. Not anymore- there is a hack for that!
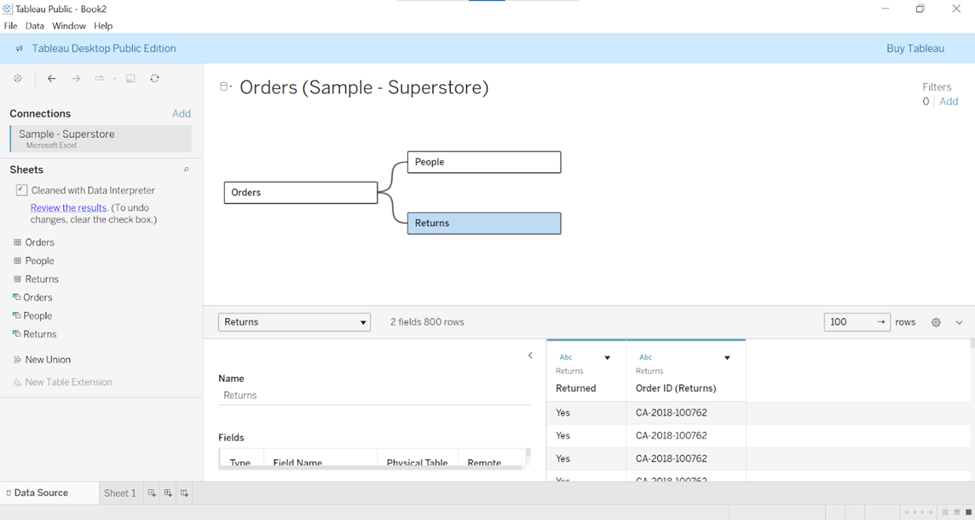
Let’s consider the Superstore dataset.
Why Superstore dataset: It is a sample dataset supplied by Tableau for new users to learn about and experiment with tableau’s various products and functionalities.
You can download dataset from above link and load it into tableau as below:
👍 Tip
If you want to dynamically change display units for the sales measure in the sample superstore dataset, the first formula would be as follows:
IF SUM([Sales]) >=1000000000 THEN SUM([Sales]) / 1000000000
// This logic normalizes values above 1 billion
ELSEIF SUM([Sales]) >=1000000 THEN SUM([Sales]) / 1000000
// This logic normalizes values above 1 million
ELSEIF SUM([Sales]) >=1000 THEN SUM([Sales]) / 1000
// This logic normalizes values above 1 thousand
ELSE SUM([Sales])
//this logic results in the raw value being shown for values under 1000
END

For this example, let’s also set the default formatting of this calculated field so that it always has a dollar sign and two decimal places.
To modify the default formatting of a calculated field, in the measures area of the data pane, right click it and click number format. This will open the default number format dialog box.

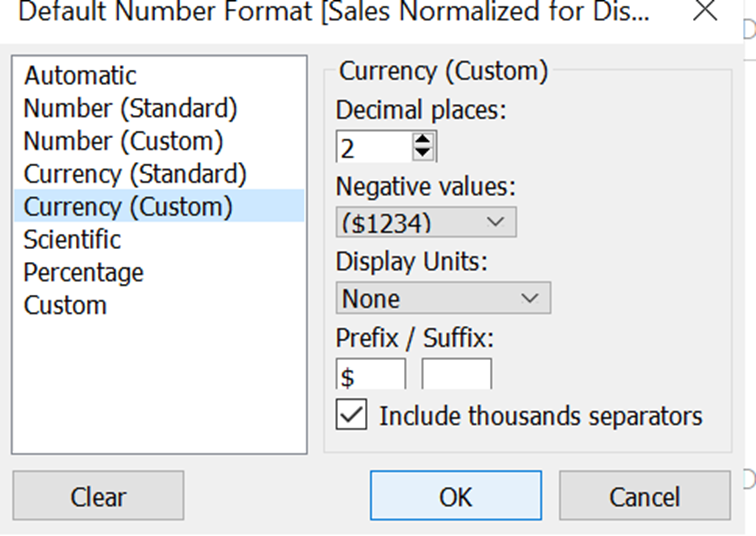
The Prefix will always be a dollar sign but leave the suffix blank because that is what we will dynamically control with the next step.
👍 Tip
The Second calculated field displays the appropriate format based on the measure value.
Here is the formula to show B for billions, M for millions and K for thousands:
IF SUM([Sales]) >=1000000000 THEN 'B'
// This logic displays B for billion
ELSEIF SUM([Sales]) >=1000000 THEN 'M'
// This logic displays M for million
ELSEIF SUM([Sales]) >=1000 THEN 'K'
// This logic displays K for thousand
ELSE ''
// This logic displays a blank space for values under 1000
END

To use this in a text table, place the normalization and suffix calculated fields on the Text Marks Card together. You can format the text so that two results from the calculations are on the same row, making them appear seamless. You can also format text for style such as font, size and color.

We are looking at the total sales amount for the superstore dataset file, which is $2,297,201. Because this number is greater than one million, our normalization calculated field divided it by one million and our suffix calculated field displayed an M.
If I add the region dimension to the view, which has dimension members with values between one thousand and one million the calculations work to properly normalize the values into thousands and display a K :

Note that the normalization and suffix calculated fields compute the results at the viz level of detail, so be aware that you can get a mix of results. Here is an example when using ship mode as the dimensional breakdown :

The normalization calculation happens at the viz level of detail, you might end up with some dimension members being divided by different numbers.
The misleading effect is particularly problematic for visualizations because every number, regardless of how it was normalized, will share the same axis scale. For Example, if one bar has been divided by one million while another bar was divided by one thousand, the best performing dimension member will appear to have performed the worst! This is still an effective tactic for dynamically changing labels on visualizations (as opposed to marks).
For the last example, let’s break the normalized sales measure down by the product name dimension:

As you can see whenever a product has a thousand dollars of sales or more, our calculations normalized the result into thousands with a K. The values under one thousand dollars in sales get no display units and the raw result in currency formatting is displayed.
The sample superstore dataset does not have an example of sales greater than one billion, but our calculations would work the same way as you have seen with millions and thousands.
This approach also theoretically works with trillions. You may try!
Thanks for reading,
Happy Learning!


