Hawaii’s Airbnb Market Analysis using Tableau
- Subasini Clattus
- Sep 2
- 4 min read
Hawaii Airbnb is one of the most iconic travel destinations in the world. It has highly competitive sector, contributing remarkable profit potential due to visitor demand and wide range of accommodation types. I built an interactive tableau dashboard to uncover key trends, identify top-performing areas, and provide actionable insights for hosts, visitors and authorities.

Data & its Preparation
I used a publicly available dataset of Airbnb listings which covers all major islands in Hawaii. The dataset has details of listing data, host information, pricing, occupancy, and revenue which is from March 2025 to March 2026. Before diving into analysis, I performed data cleaning and transformation which includes joining multiple table to link listings with booking and host information , handling missing values, and created several calculated fields to derive key metrics like total revenue, average price ,total host, and total listings. This significant preparation is important to ensure accuracy and dependable dataset.
Visualization & Analysis
One of the most important steps in data analysis is questioning about that dataset. I started my analysis by listing the questions I want to know and am curious about. These are the few questions I had about this dataset:
Which island and neighborhood are driving the most revenue?
How many hosting are in the dataset?
How many different rooms are there, and which room types have the highest listing and yielding the most revenue?
Which host has the highest number of reviews?
How many listings does each host have?
Then I designed a detailed dashboard with multiple charts and KPI, each provides specific purpose in telling the data story. Here some of the key insights I uncovered.
KPIs – I started with KPIs to have a high-level market overview.
o Total Listings: 36,125
o Total Hosts: 9,745
o Total Revenue: $21,01 Billion
o Average Price: $ 347.43
These numbers show the high market value with significant revenue generated across the islands.

Bar charts for Distribution: The bar chart is ideal for comparing categorical data.
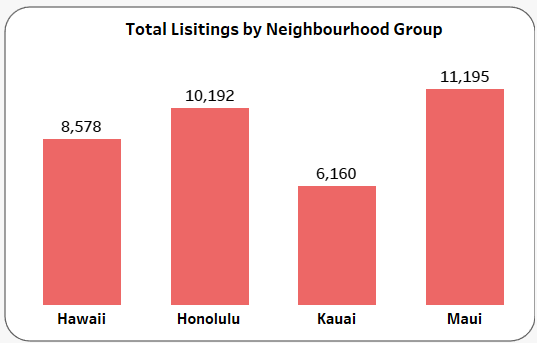
Total listing by Neighborhood group: The neighborhood group include Hawaii, Honolulu, Kauai, Maui. Among that, Maui leads in listing by neighborhood with 11,195 listings followed by Honolulu with 10,192 listings. I used this chart as filter which allows the data to slice by neighborhood group, instantly updating all charts on the dashboard to reflect island’s performance.
Total listing by Room Type: This bar chart is about what type of accommodation has more listing. Accommodation/ Room Type are categorized into entire home/ Apt, hotel room, private room, and shared room. Entire home/apt has the highest listing of 31,752. Private has 3,816 listing and shared room as the least.

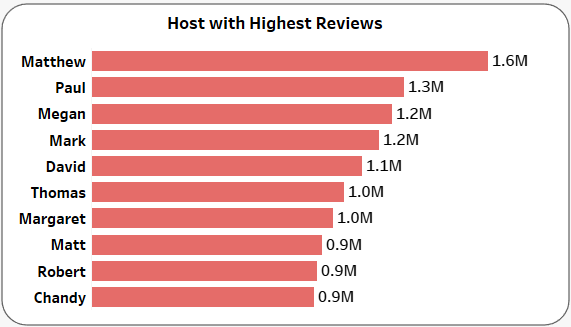
Host with Highest reviews: This visual is about the host and their reviews. In that Matthew has highest of 1.6m followed by Paul with 1.3M reviews.
Listings Per Host: This bar chart is about listings per host, 23,938 hosts manage more than ten listings, while 5573 hosts have just one listing.

Occupancy range by Listings: This chart showed that 13,551 listings had 0 occupancy while 8177 had an occupancy of 1-30 days.

Table Chart to visual top Host: Host with Most Listing In market, which host has the highest listing. I listed top 10 hosts who have the highest listing in the market. Matthew has the highest with 889 listing.

Pie Chart for Licensing: A pie chart was used for Host license breakdown because it is the best way to show proportions. In that 82% host have license and 18 % do not have license

Tree map for Revenue: Tree map to visualize revenue by Neighborhood, in that Maui-Kihei Makena has the highest revenue of 3.35 billion.

Pareto Chart for Neighborhood revenue distribution: This advance chart was used to demonstrate that small number of neighborhood (e.g., Kihei – Makena, Primary urban center) generate highest revenue, highlighting the 80/20 rule. I used a running total table calculation to show the cumulative percentage of revenue.

Key Insights: My analysis uncovered various insights that can help in better understanding and making better decisions.
Maui is the top revenue generating island with highest listing. By applying the neighborhood group filter to select “Maui.” The dashboard instantly updates to show detailed metrics for the island.
Total Listings: 11,195
Total Hosts: 2,745
Total Revenue: $ 6.58 Billion
Avg. Price: $ 417.73
Licensing: 98% of Maui hosts were licensed
Room Type: Entire homes/apartments dominated with 10,077 listings.
Occupancy: 4,891 listings had 0 occupancy, and 3,044 had 1-30 days of occupancy
Revenue distribution: The Pareto Chart showed that Kihei – Makena alone accounted for 51% of the running total revenue on the island.
The distribution of listings per host shows a considerable number of hosts managing multiple properties, implies that few host drive large portion of market.
A large majority of hosts are licensed. It is important for local authorities interested in compliance and tax revenue.
The highest number of listings with zero occupancy suggest potential market saturation or seasonality that host need to be aware of. This helps potential hosts make informed decisions about entering the market.
Conclusion
This analysis confirms that Maui is not only lead in the number of listings but also in revenue, host licensing, and average price. This dashboard provides hosts with a tool to identify profitable neighbors, evaluate their competition and understand market trends. The concentration of earning in neighborhood suggests high demand zones worth monitoring for investment, regulation, or service expansion.


