From Raw to Ready: Cleaning and Analyzing Netflix Data in Power BI.

While I was looking for ideas for my first blog. I stumbled upon a Netflix data set in Kaggle. I then decided to practice and record the data cleaning process using this dataset. In this blog, I will explain how I used Microsoft Power BI to clean and transform a real-world Netflix dataset. I will go over each step of the data preparation process and explain how to get raw data ready for analysis.
About the data set:
The raw dataset contains 8,807 entries and 12 columns, where each row represents a unique movie or TV show available on Netflix.

Data cleaning:
Data cleaning is a key step in data analytics. It is the process of locating and fixing errors or inaccuracies in the data. These errors could be the result of a number of factors, including incorrect data entry, missing fields, outliers, duplicates, and more. Data cleaning helps ensure that the information within the dataset is correct and precise. The ultimate goal of data cleaning is to make sure the data is accurate, consistent, and relevant.
The Process:
Here’s the breakdown of how I prepared the data for visualization.
Step 1- Uploading Raw Data
I started by using the Power Query Editor to import the raw data .csv file into Power BI. To ensure that every column was appropriately labeled, I promoted the first row as headers after loading the data.
Step 2 – Column Profiling
The column profiling is performed to understand the column details like column type, identifying nulls, value distribution, etc. It helps me to identify key initial data cleaning tasks.
Step 3- Handling Missing Values
Columns like director had missing values, which I verified and flagged as “Director missing.”
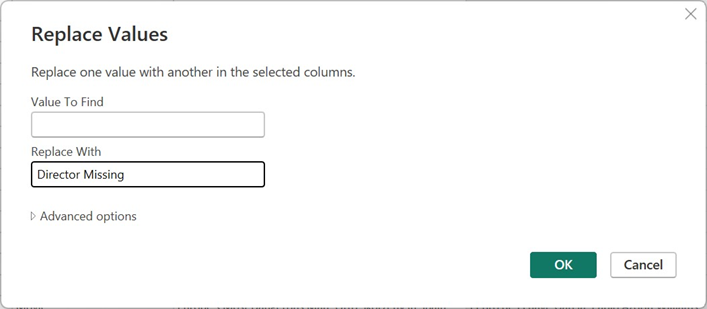
Step 4 – Imputing with mode (most common rating)
I examined the Column Profile and Column Distribution and discovered that United States has the most records of movies and TV shows, so I replaced the null values in the country column with "United States."

Step 5- Splitting/Extracting Data
The raw Netflix dataset had a particularly tricky column ”listed_in”. This was the column that contained the genre of each title. But instead of having a single genre per row, it had multiple genre stored together in a single cell, separated by a comma.
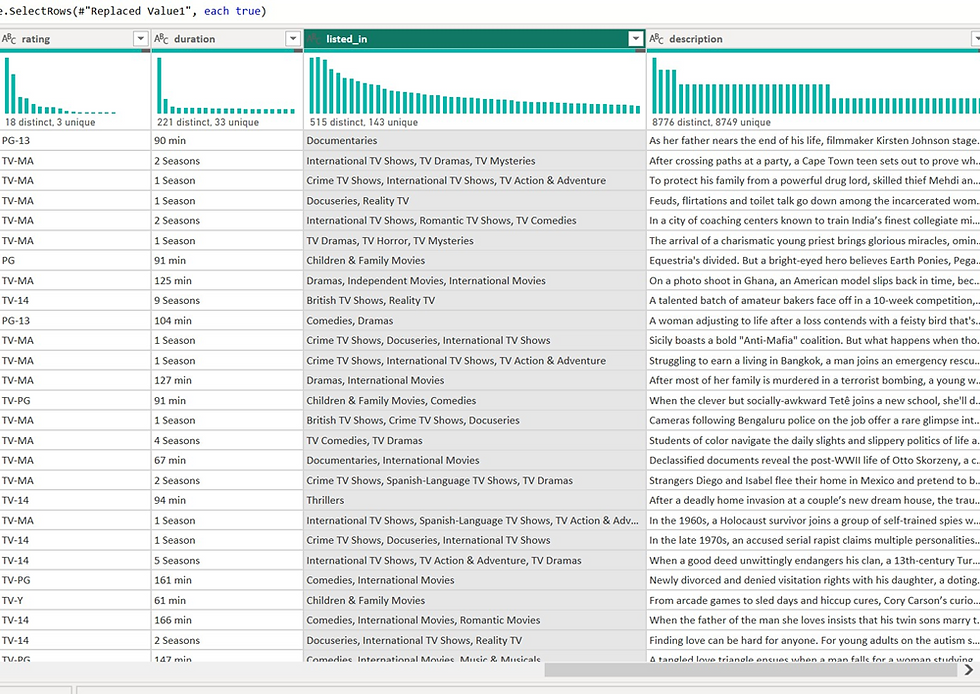
For example, if I were to ask a basic question like
How many children & family movies are there on Netflix?
The accurate answer cannot be fetched unless this column is cleaned properly. The solution I applied was to split the categories into multiple rows using Power Query and trimmed the spaces to achieve consistency. These minor yet necessary steps contributed to cleaning the Netflix dataset for analysis purposes.
Step 6- Add a Calculated Column for Duration (Minutes)
While working on data cleaning, I found that the duration column has two formats i.e. minutes for movies and seasons for TV shows. It cannot be directly analyzed. To make it simpler, I created a new column which contains only the extracted duration of the movies in minutes. I went into Add Column Tab in Power Query and selected Conditional Column.

With a simple if–then statement, if the duration value contains a “min”, I hold the value of the new column. This column will help to distinguish movie duration and TV seasons, which can be analyzed later.
Step 7- Text Analysis using the Description Column
Here I created a simple descriptive text analysis using description column to analyze.
How many titles are about murder mystery?

I used Conditional Column in Power Query to create a new column named “Murder Mystery?” based on the conditions that run through the description columns. The conditions are based on the logic that if the description consist of the values “murder”, “death”, “kill” then it will return the value “yes”, else, return the value “no”.
For instance, if the description say that a murder is happening or a suspicious death, then it will return. With the use of this simple logic, one can identify how much content there is from the provided list that falls into the murder mystery based on the description of the material.
Final Step—Filtering the Data
As I reached the final stage of data cleaning, I filtered out columns that were not required for my analysis. Keeping unnecessary columns can add noise and make the dataset harder to work with. By removing them, I ensured the data remained clean, focused, and ready for further analysis.
This ends the data cleaning process.
My learning from this project-
· Real-world data can be messy and needs to be cleaned properly before it can be analyzed.
· Breaking multi-value columns into separate rows provides more precise results.
· Trimming spaces and using lower case can avoid problems with big data.
· Using conditional columns option is a good way to handle mixed data formats.
· Removing irrelevant columns makes the data attractive and easier to analyze.
Thanks for reading!


