From Data to Decisions: A Friendly (and Slightly Rambling) Guide to Linear Regression

Wait, What Even Is Machine Learning?
Okay, so picture this: you’re trying to teach your nephew what an apple is. You don’t give him an exhaustive checklist — “red, kinda round, sweet-ish?” Nah. You show him enough apples and go, “These.” And before long, he kinda gets it.
That’s basically machine learning: instead of hardcoding rules, we feed the computer a bunch of examples and let it connect the dots.
And when you’re just getting started? Linear regression is usually your first stop. It’s the humble butter knife of ML — not flashy, but always ready to do the job.
Meet Linear Regression
Linear regression is your buddy when you’re staring at a scatterplot and thinking, “Hmm, that looks like a line.”
Let’s say you’re looking at house prices. More square footage? Probably higher price. Linear regression jumps in and draws the “best fit” line through your data to help you predict stuff — like what a 1,500 sq ft house might cost.
It’s super useful when:
You’re predicting a number
The trend sorta looks straight
You need something quick and not too mysterious
What Exactly Is Linear Regression?
Imagine you’re house hunting, scrolling through Zillow like a maniac, and you notice — wow, bigger homes tend to be more expensive. Linear regression basically formalizes that gut instinct into a math equation. It draws the “best guess” line through your data and says: “Here’s our prediction. Close enough?”
Slightly Nerdy History Tangent
So back in the 1800s, this guy Francis Galton (who was kinda obsessed with heredity) noticed that tall parents usually have tall kids — but not that tall. He cooked up linear regression to describe this “regression to the mean” thing. And ta-da! A statistical staple was born.
Real-World Where-You-Might-See-It Stuff
Chances are, linear regression has already touched your life. Some examples:
Real Estate: Predicting home prices using size, bedrooms, or neighborhood vibes
Sales: Figuring out how ad spend today will (maybe?) pay off tomorrow
Healthcare: Guessing blood pressure based on age or weight
School: Predicting exam scores from attendance + study hours
Farming: Estimating crop yield from rainfall, soil quality, and maybe a farmer’s gut feeling
Hot tip: If your goal is a number and your data has some pattern, give linear regression a shot.
The Two Flavors: Simple vs. Multiple Regression
Simple Linear Regression
Just one input, one output. Like:
Predicting salary from only years of experience.
It’s a straight-up line: one thing explains another. Clean, classic.
Use when: You’re pretty sure one factor is doing most of the work.
Some chill examples:
Fuel use vs. driving speed
Calories burned vs. jog time
Movie revenue vs. budget
Multiple Linear Regression
Now add more ingredients:
Salary = years of experience + education + job type + city.
Suddenly, things get spicy. Multiple variables work together to shape the outcome. It’s still a line… just in a weirder, multi-dimensional space.
Use when: There’s no single magic variable — it’s a team effort.
Examples include:
House prices based on size, location, AND condition
Product sales driven by season, price, ad spend, competitor moves
Car value based on age, mileage, brand, and whether it smells like wet dog
Just don’t go feature-crazy. More variables ≠ better if they add noise. It’s like adding too much hot sauce — cool in theory, but suddenly you’re crying at your desk.
Tip: Plot first. Guess second. Predict third.
Some Math (But No Sweating Required)
Here’s the good ol’ formula:
Y = mX + b + ε
Where:
Y is what you’re predicting (e.g. house price)
X is your input (e.g. square footage)
m is how much change in X affects Y (slope)
b is where your line crosses the Y-axis
ε is just noise — the “eh, we tried” part
Got more inputs? It turns into:
Y = b₀ + b₁X₁ + b₂X₂ + … + bₙXₙ + ε
It’s still a line, just bent through extra dimensions.
Time to Code One (Yes, Python’s Coming)
Let’s throw together a simple one using scikit-learn:
import numpy as np
import matplotlib.pyplot as plt # yep, standard plot lib
from sklearn.model_selection import train_test_split
from sklearn.linear_model import LinearRegression
from sklearn.metrics import mean_squared_error
# A bit of randomness for reproducibility (helps when debugging)
np.random.seed(42)
# Pretend house sizes — let’s say in thousands of square feet
sizes = np.random.rand(100, 1) * 10 # floats from 0 to 10-ish
# Prices are totally made up, but hey — that’s data science sometimes
prices = 2 * sizes + 3 + np.random.randn(100, 1) * 2 # fake noise added\
# Let’s split the data — nothing fancy, just 80/20
size_train, size_test, price_train, price_test = train_test_split(sizes, prices, test_size=0.2)
# Time to build a model — Linear Regression to the rescue!
model = LinearRegression()
model.fit(size_train, price_train)
# Let’s make some guesses now
predicted_prices = model.predict(size_test)
# Check how bad (or hopefully good?) our model did
error_score = mean_squared_error(price_test, predicted_prices)
print("MSE:", error_score) # lower is better, obviously
# Let’s throw it on a chart and eyeball how we did
plt.scatter(size_test, price_test, color='blue', label='Actual Prices')
plt.plot(size_test, predicted_prices, color='red', label='Model Prediction')
plt.title("Simple Linear Regression Demo")
plt.xlabel("House Size (arbitrary units)") # I mean, they’re made up
plt.ylabel("Estimated Price")
plt.legend()
plt.grid(True)
plt.show()
Interpreting the Result
Alright, let’s break down what just happened:
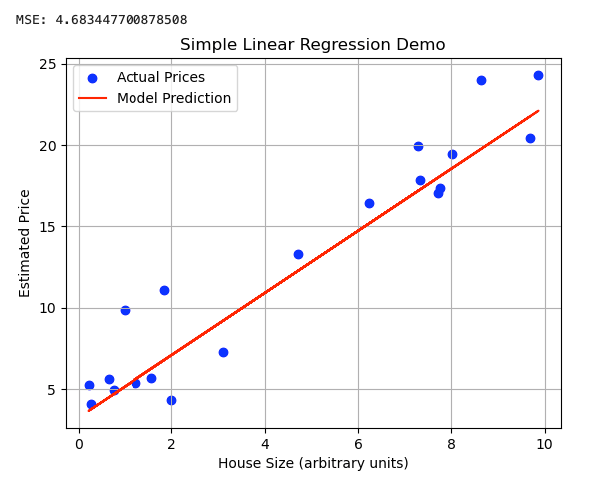
The Mean Squared Error (MSE) came out to about 4.68, which tells us how far off, on average, our model’s predictions are from the actual values — squared. Lower MSE = better accuracy. It’s not perfect, but definitely respectable given the randomness we added in.
The blue dots? That’s our actual test data — real(ish) house sizes and their corresponding prices.
The red line? That’s the model’s best attempt to predict prices based on size. It’s the line it thinks represents the general trend in the data.
And honestly? Not bad at all! Most of the dots hang around the line, which means the model is doing a solid job capturing the relationship between house size and price.
Is it flawless? Nope. We sprinkled in noise on purpose. But it still found the trend: bigger house → higher price. Job well done, little regression model.
Bonus wisdom: If your dots are sticking close to the line like loyal puppies, your model’s doing well. If they’re scattered like confetti at a wedding — it might be time to revisit your features or try a different model.
When Linear Regression Is Your Pal
You want a no-fuss, easy-to-explain model
The relationship looks kinda straight
You’re still figuring out your dataset
You’re prototyping something fast
When to Skip It (Sorry, Line)
Data’s all over the place (like spirals, or loops, or other weirdness)
Too many outliers skewing everything
You’re pretty sure the relationship isn’t linear
Where to Go From Here
After linear regression, you might want to try:
Polynomial Regression (when that line needs a curve)
Ridge & Lasso (like linear regression, but with more chill)
Decision Trees (when you’re tired of straight lines)
Neural Networks (for when you have too much data and caffeine)
Final Thoughts
You just tackled one of the most classic tools in machine learning. It’s the intro song, the first pancake, the base camp before the Everest climb.
Keep tinkering, keep plotting, and don’t be afraid to mess up. Remember: the line may be straight, but your learning path definitely won’t be!


