Financial Analysis Using Pivot Table and Power Query - Transforming Raw Data Into Actionable Insights

Introduction
Financial Analysis is the heart of every successful business decision. Be it be evaluating company performance, understanding the expenses, calculating the revenue, understanding the market trends, financial analysts rely on timely and accurate data analysis. Working with large data sets becomes very tedious and difficult when data is scattered across multiple files, systems or reporting periods.
Luckily, Microsoft Excel has two very important features- Pivot Table and Power Query .
These make data cleaning, organizing, summarizing, analyzing and visualization very easy.
Both these tools can be used to make efficient financial reporting workflows and generate meaningful business insights.
What is a Pivot Table?
A Pivot Table is Excel's most powerful analytical feature. It allows users to summarize, group, filter and analyze large datasets without writing complex formulas .For financial analysts, it helps in answering critical questions like-
Which department has the highest expense?
Which department has the highest revenue?
Which product has highest sale/highest profit? And many more.
Challenges of Raw Financial Data
Although Pivot Tables are powerful, their effectiveness depends on the quality of the underlying data. Financial datasets often contain issues such as like-
* Duplicate records
* Missing values
* Inconsistent formatting
* Multiple source files
* Unnecessary columns
* Data spread across different worksheets
Analysts frequently spend more time cleaning data than actually analyzing it. This is where Power Query plays the important part.
What is Power Query?
Power Query is Excel's data preparation and transformation tool. It allows users to connect to multiple data sources, clean and transform data, and automate repetitive preparation tasks.
Instead of manually performing the same cleaning steps every month, Power Query records the transformation process and automatically applies it whenever new data is loaded.
Power Query can connect to:
Excel workbooks
CSV files
Databases
Web pages
Cloud services
ERP and accounting systems
This capability makes it an ideal solution for recurring financial reports.
Now let's understand each of Power Query and Pivot Table and try to answer some financial analysis questions using the dataset below-
Date | Region | Product | Revenue($) | Cost($) |
01-Jan-2025 | East | Laptop | 12,000 | 8,500 |
02-Jan-2025 | West | Monitor | 6,500 | 4,200 |
03-Jan-2025 | North | Laptop | 15,000 | 10,200 |
04-Jan-2025 | South | Keyboard | 2,500 | 1,300 |
05-Jan-2025 | East | Monitor | 7,200 | 4,800 |
06-Jan-2025 | West | Laptop | 13,500 | 9,000 |
07-Jan-2025 | North | Keyboard | 3,000 | 1,700 |
08-Jan-2025 | South | Monitor | 5,800 | 3,900 |
Step 1:
Save the dataset in Excel.
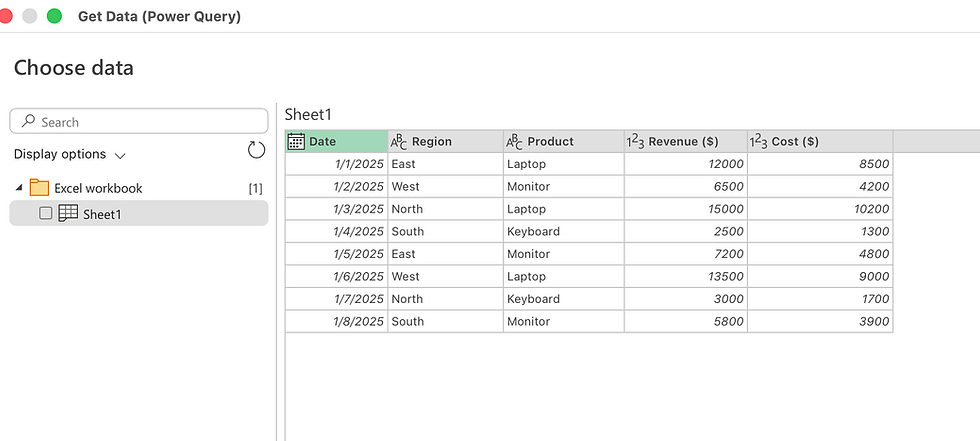
Import the dataset in Power Query Editor .
Verify data types. Check if the Date is in Data format, Revenue and Cost are in Currency.
Step 2:
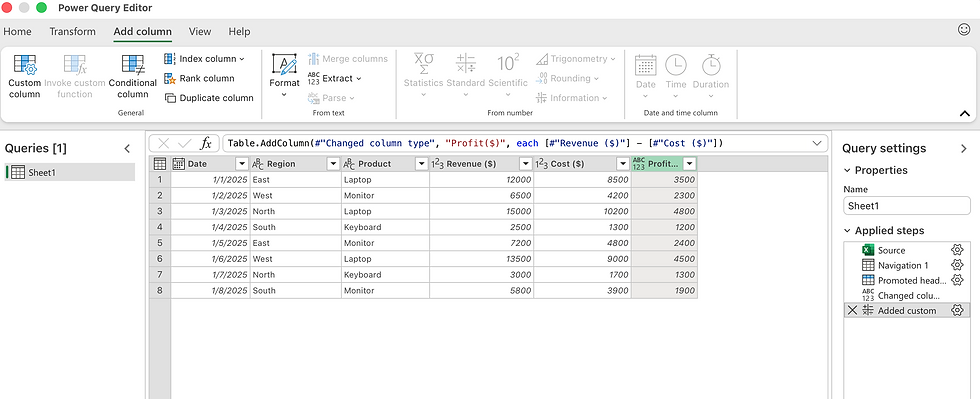
In power query add a profit column to the dataset.
Profit =[Revenue ($)]-[Cost ($)]
Step 3:
Load Data Back to Excel
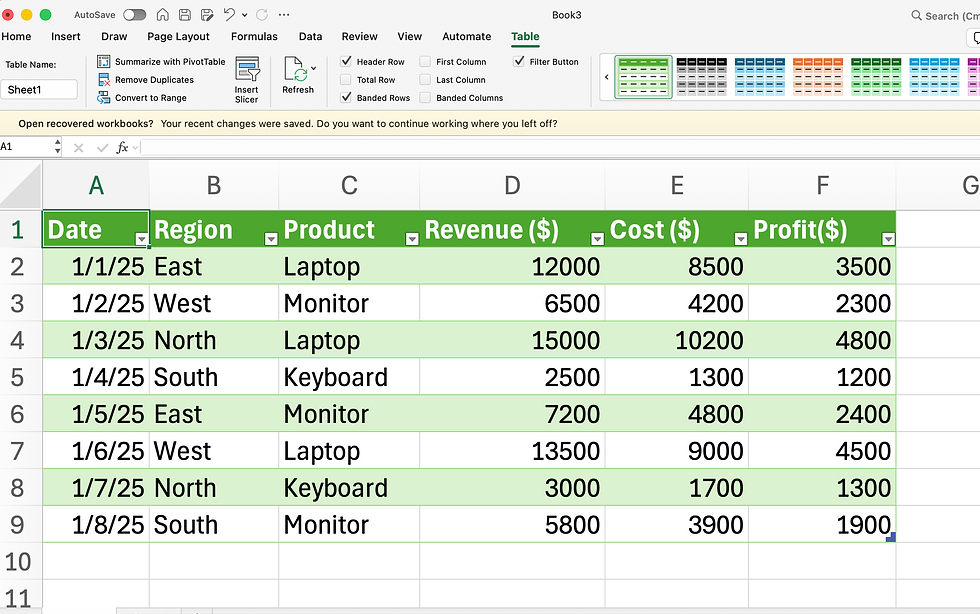
Your clean dataset is now ready for analysis.
Let us try to answer some of the financial questions-
Q1. Which region makes the highest profit?
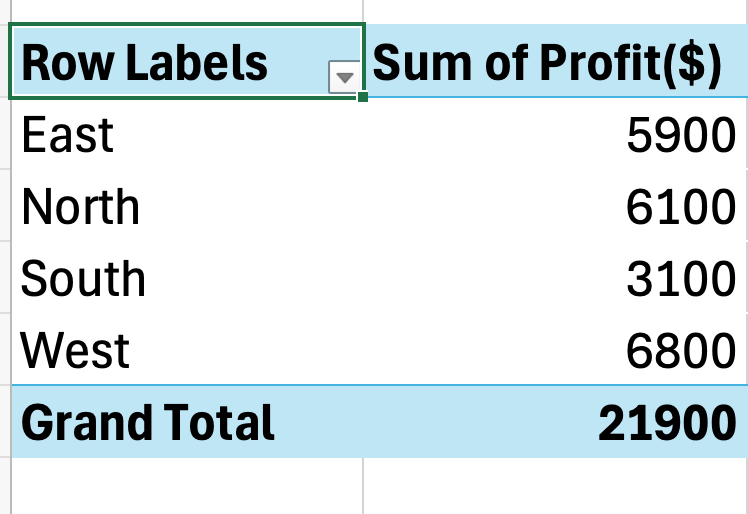
So we made a pivot table with Region and Profit and it is very clear that West Region makes the highest profit. This insight will help companies understand the maximum sale products in the west region and always keep those stuffs in stock to increase the market.
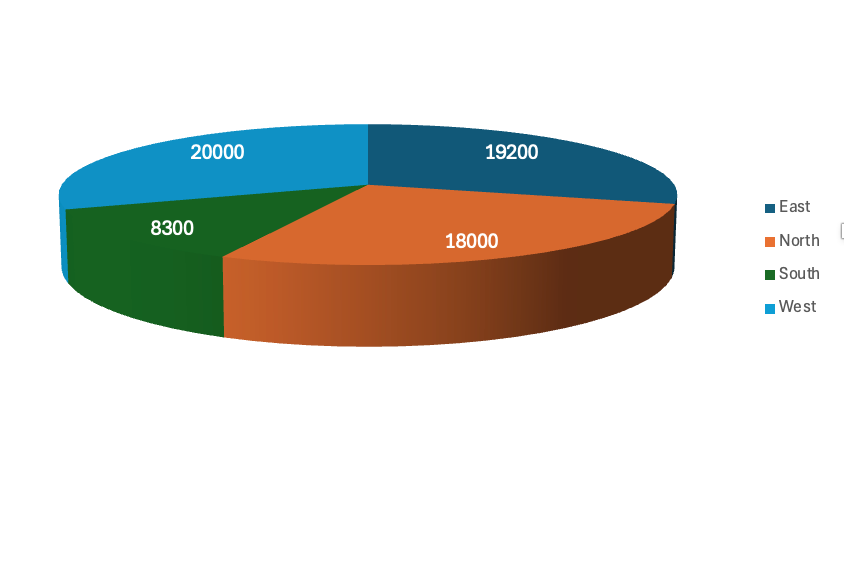
Let's add a pivot chart to create visualization and understand that West Region contributes more toward profit.
Q2. Which Product Is Most Profitable?
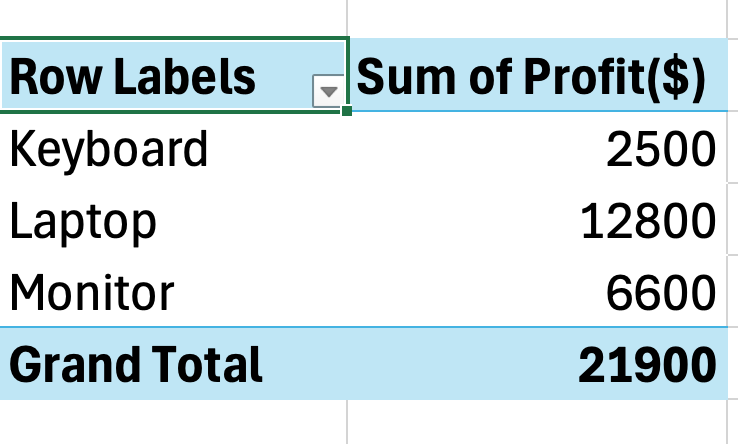
We will create another pivot table with Product and Profit. From this we understand that Laptops make the highest profit. This insight will help companies to manufacture and distribute more laptops.
Q3. Now let's Understand Revenue vs Cost Analysis using a pivot chart.
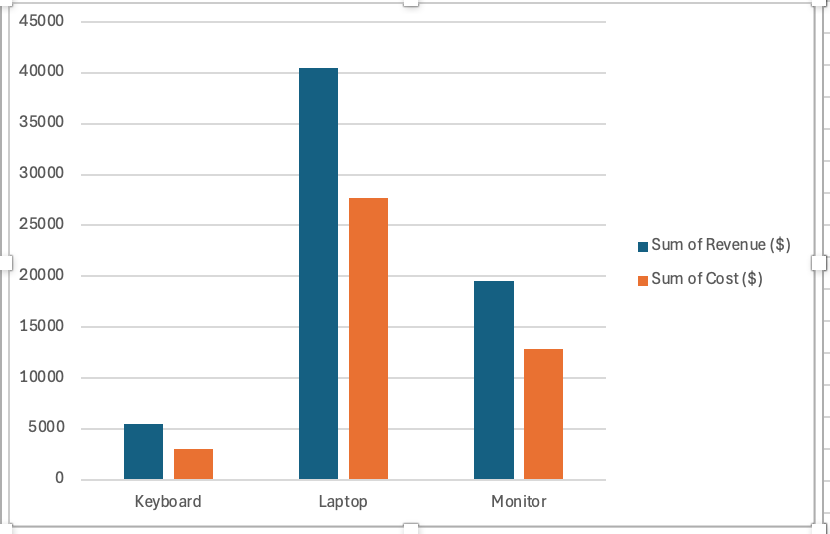
The clustered column chart quickly reveals products with stronger margins and identifies areas where costs consume a large share of revenue.
Without Power Query and Pivot Tables:
Profit calculations would be manual.
Reports would need frequent rebuilding.
Errors would be more likely.
With Power Query and Pivot Tables:
Automatic calculations
Dynamic reporting
One-click refresh
Better financial insights
Taking Analysis one step forward and advanced is by creating visualization using Pivot Charts.
In question 1 and 3, we see the visualization is created using pivot charts and analysis and insights derived.
Numbers tell a story, but visuals make that story easier to understand.
Pivot Charts are directly connected to Pivot Tables and automatically update whenever the data changes. Most popular financial visualizations are bar charts, pie charts and line charts.
Conclusion
Using a simple sales dataset, we transformed raw transaction data into meaningful business intelligence. Power Query handled the data preparation while Pivot Tables and Pivot Charts provided instant answers to key financial questions.
This workflow demonstrates why Power Query and Pivot Tables are among the most powerful tools available to modern financial analysts.
Financial analysis is no longer just about collecting numbers. It is about turning data into actionable business intelligence and insights.
Power Query and Pivot Tables provide a practical, scalable and efficient solution for modern financial reporting.
The insights derived can be beautifully visualized using Pivot charts.
Together, they help finance professionals automate data preparation, reduce errors, and uncover insights that drive better business decisions.Having a good understanding of these Excel tools can significantly improve your productivity and analytical capabilities.
As organizations continue to rely on data-driven decision-making, the combination of Power Query and Pivot Tables remains one of the most valuable skills any finance professional can develop.


