Explore Your Data Before Cleaning in PostgreSQL

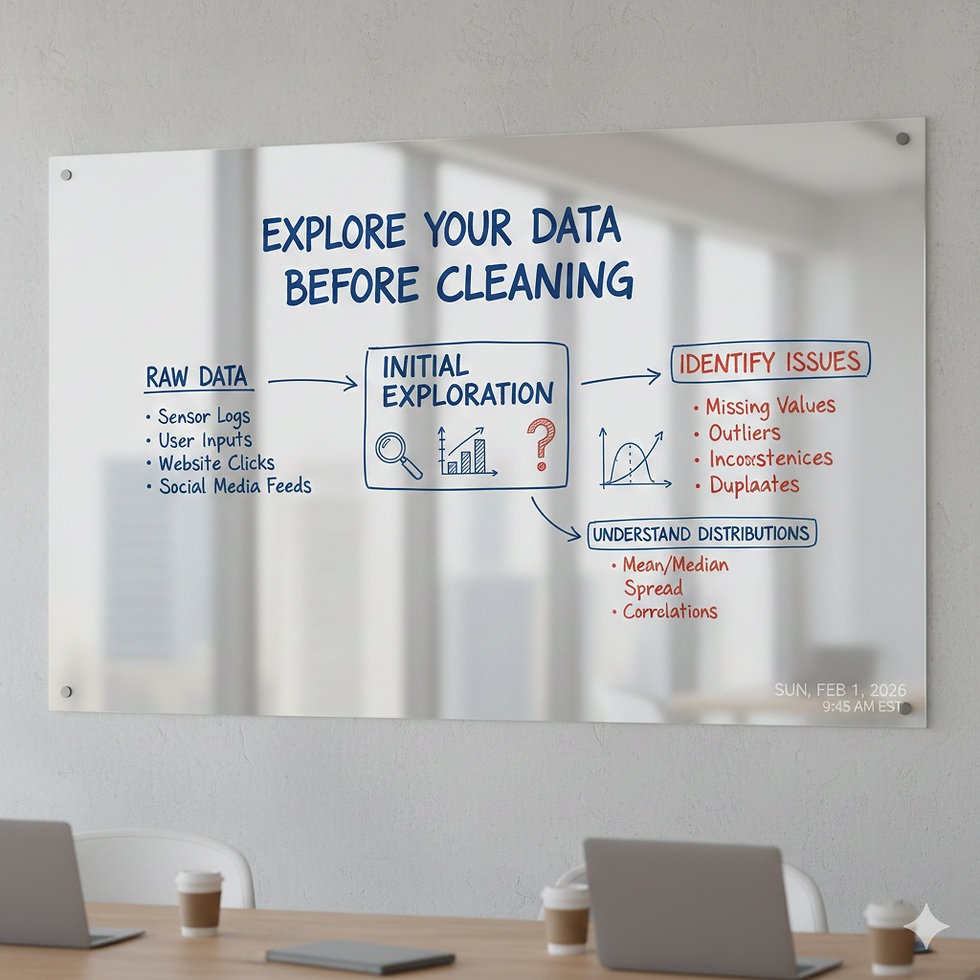
When you start working with any dataset, the first step is NOT cleaning. The first step is exploring your data. This means taking a quick look at what your table contains so you know what you’re working with.
Think of it like checking your room before you start organizing it. You look around, see what’s messy, what’s missing, and what needs fixing. Data exploration works the same way.
When you explore your data, you learn things like:
What columns your table has
What type of information each column stores
Whether the values look correct
Whether anything is missing
Whether there are duplicates
Whether something looks unusual or wrong
This step helps you understand your dataset clearly before you start cleaning it. Once you know what’s inside, you can clean it faster, better, and with fewer mistakes.
In this guide, you’ll learn simple PostgreSQL commands that help you explore your data step by step — perfect for beginners.
1. Look at the Structure of Your Table
Before touching anything, check what your table looks like.
To See table structure
SELECT column_name, data_type
FROM information_schema.columns
WHERE table_name = 'students';
This tells you:
What columns exist
What type of data each column stores (text, number, date, etc.)
This is like reading the “ingredients list” of your dataset.
2. View a Small Sample of Your Data
Never start by looking at the entire table. Just peek at a few rows.
To View first 10 rows
SELECT *
FROM students
LIMIT 10;
This helps you quickly spot: Wrong spellings, Strange values, Empty fields, Formatting issues.
3. Count How Many Rows You Have
Knowing the size of your dataset helps you plan your cleaning steps
To Count rows
SELECT COUNT(*) AS total_rows
FROM students;
If the number looks too small or too large, something might be wrong.
4. Check for Missing Values (NULLs)
Missing values are very common in real‑world data.
To Count NULLs in each column
SELECT
    COUNT(*) FILTER (WHERE name IS NULL) AS name_nulls,
    COUNT(*) FILTER (WHERE email IS NULL) AS email_nulls,
    COUNT(*) FILTER (WHERE age IS NULL) AS age_nulls
FROM students;
This tells you which columns need attention.
5. Check for Duplicate Rows
Duplicates can cause wrong results in analysis.
Find duplicate emails.
SELECT email, COUNT(*)
FROM students
GROUP BY email
HAVING COUNT(*) > 1;
If you see any rows here, you know duplicates exist.
6. Look at Value Patterns
Sometimes values are technically valid but still wrong.
Examples:
Age = 200
Email without “@”
Date of birth in the future
To Check unusual ages
SELECT *
FROM students
WHERE age < 0 OR age > 120;
Check invalid emails (simple check)
SELECT *
FROM students
WHERE email NOT LIKE '%@%';
These checks help you catch “weird” data early.
7. Explore Unique Values
This is helpful for columns like gender, status, category, grade, etc.
To See unique values
SELECT DISTINCT gender
FROM students;
If you see values like:
“M”, “Male”, “male”, “m”
“F”, “Female”, “female”, “f”
…you know you’ll need to standardize them during cleaning.
8. Check Basic Statistics (for numeric columns)
This helps you understand the range of your data.
Summary statistics
SELECT
    MIN(age) AS min_age,
    MAX(age) AS max_age,
    AVG(age) AS avg_age
FROM students;
If the minimum or maximum looks unrealistic, you know something needs fixing.
Look Before You Clean
Exploring your data before cleaning is like reading a map before starting a journey. You don’t want to walk in the wrong direction, fix the wrong things, or miss important problems. When you take a few minutes to look at your data first, everything that comes after becomes easier and more accurate.
Exploring your data helps you:
Avoid mistakes You won’t accidentally delete good data or fix something that wasn’t broken.
Understand the real problems You can clearly see what’s missing, what’s messy, and what needs attention.
Plan your cleaning steps Instead of guessing, you know exactly what to fix and in what order.
Save time A quick look now prevents hours of rework later.
Produce better results Clean, well‑understood data leads to clear insights and trustworthy analysis.
In simple words, exploring your data first gives you a clear picture of what you’re working with. It prepares you to clean confidently and correctly, just like checking your route before you start driving.
Conclusion - Slow Down to Speed Up
Exploring your data is the most important first step before cleaning. When you take a few minutes to look at your table, check the columns, scan a few rows, and notice missing or strange values, you understand what your data really looks like. This helps you avoid mistakes and makes your cleaning work faster and easier.
Think of it like checking your backpack before a trip. When you know what’s inside, you can fix problems early and stay prepared. In the same way, exploring your data gives you a clear picture so you can clean it with confidence.
Once you understand your data well,
Now, you’re ready for the next step: cleaning it properly and safely.
🌼 Happy Reading!


