Enhance Your Tableau Skills: The Essential Guide to Filters and Their Sequence
Updated: Apr 16, 2025
Understanding how Tableau processes and filters data to create your view is key to mastering the tool. This process, known as the order of operations, outlines the sequence Tableau follows when applying filters and calculations. Knowing this order can be incredibly helpful, allowing you to leverage it effectively for filters, level of detail calculations, or troubleshooting issues when Tableau doesn't display your desired view.
Decoding Tableau’s Processing Sequence
Tableau’s processing sequence, functions much like the mathematical order of operations many of us learned in school. In math, there’s a clear hierarchy: operations within parentheses are performed first, followed by exponents, then multiplication and division, and finally addition and subtraction. Similarly, Tableau employs a specific sequence to determine the order in which its various operations—such as filters, calculated fields, sets, and table calculations—are executed.
This systematic approach is crucial because it governs how Tableau processes and computes your data to generate visualizations. Each step in the sequence builds on the previous one, influencing the resulting output. By understanding Tableau’s Order of Operations, you can ensure your filters, calculations, and other features are applied in the right sequence, enabling you to create accurate and meaningful dashboards.
Flow Diagram of the Order of Operations
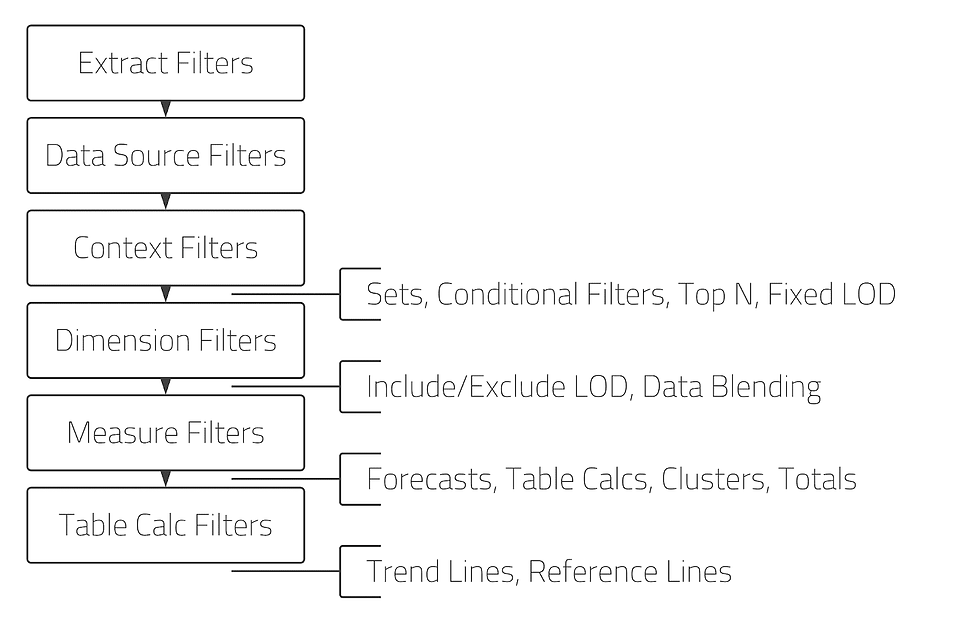
The various types of filters are presented along with other Tableau features, including LOD calculations, table calculations, totals, and reference lines. The flow progresses from top to bottom, illustrating the hierarchical order in which these operations are carried out.
1. Extract Filters
When They Are Applied: Extract Filters are utilized early in the data processing workflow, specifically during the setup of your data connection.
Key Characteristics:
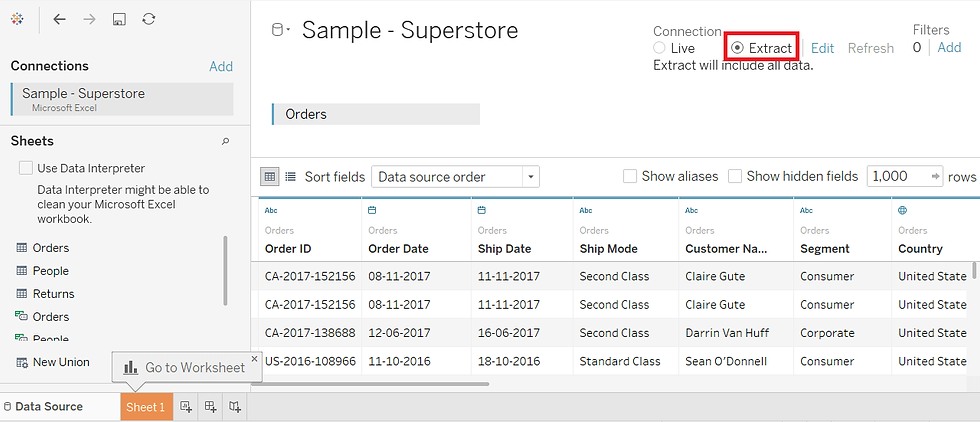
During Data Extraction: These filters define which specific data subset is extracted from the data source to Tableau, ensuring that only the necessary data is brought in.
Level of Application: Extract Filters operate at the data source level, providing control over the data that is pulled into Tableau for further analysis.
2. Data Source Filters
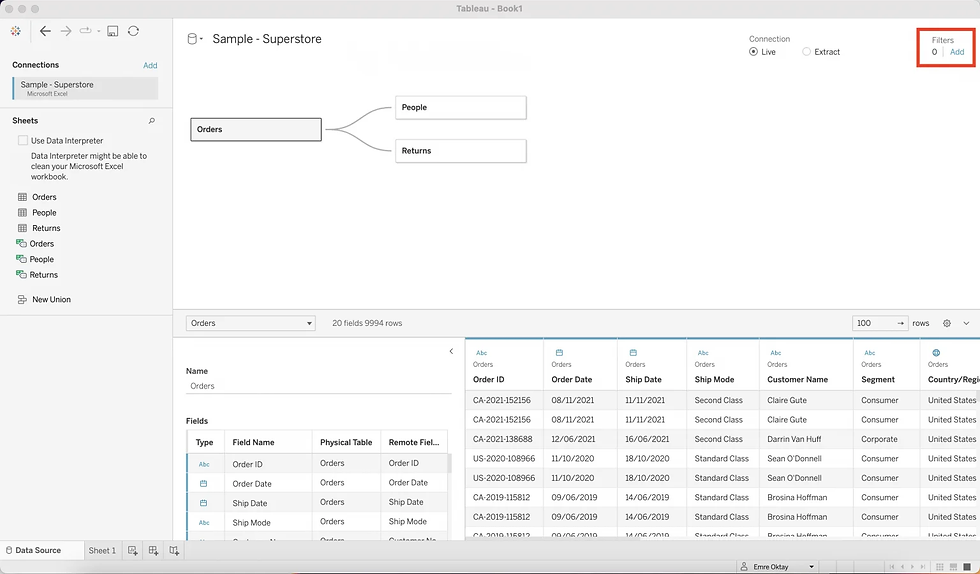
When They Are Applied: Data Source Filters are applied once the data has been loaded into Tableau, and can be accessed via the Data Source tab, typically located on the left side of the interface.
Key Characteristics:
After Data Import: Unlike Extract Filters, Data Source Filters work on the data that has already been imported into Tableau, allowing you to refine the data further.
Global Scope: These filters have a wide-reaching impact, affecting all worksheets and dashboards that are linked to the same data source, ensuring consistent filtering throughout your Tableau project.
3. Context Filters
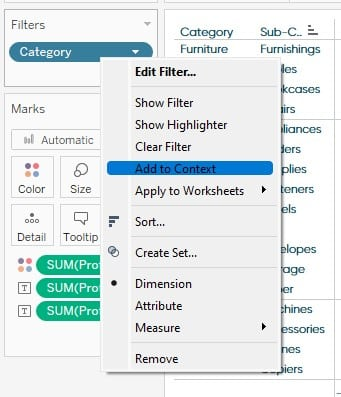
When They Are Applied: Context Filters are applied within your worksheet. You can access them by right-clicking a field in the Filters shelf and selecting the option to set it as a context filter.
Key Characteristics:
Focused Analysis: Context Filters allow you to refine your analysis by focusing on a specific subset of data, without altering the original data source or impacting other worksheets.
Customizable Context: Users can define and adjust the context based on specific analytical needs, offering a flexible and dynamic way to narrow down data for in-depth analysis.
3.1 Sets
When They Are Applied: Sets are created by selecting a subset of your data based on specific conditions. You can access Sets by right-clicking on a dimension and selecting "Create Set."
Key Characteristics:
Dynamic Data Subsets: Sets enable you to define dynamic subsets of data based on particular conditions. These subsets can be used across multiple worksheets, offering a flexible approach to analyzing distinct portions of your data.
Customizable Membership: You have full control over which data members are included in the set, with options to base the selection on conditions, ranking, or manual choices.
3.2 Conditional Filters
When They Are Applied: Conditional Filters, also referred to as Top N or Range filters, are applied directly to a measure in your view. To access them, right-click on a measure and select "Filter."
Key Characteristics:
Measure-Driven Conditions: Conditional Filters operate based on measure values, enabling you to set criteria such as displaying the top N items or filtering within a specific range of values.
Real-Time Flexibility: These filters are dynamic, automatically adjusting as your data changes, offering real-time responsiveness to shifts in your dataset.
3.3 Top N
When They Are Applied: Top N filters are a type of Conditional Filter and can be accessed through the Filter menu by selecting the "Top" tab.
Key Characteristics:
Emphasizing Leading Data: Top N filters are designed to highlight the top performers based on a selected measure. This is ideal for spotlighting the highest values, such as sales, profits, or any other key metric.
3.4 Fixed Level of Detail (LOD) Filters
When They Are Applied: Fixed LOD Filters are created using calculated fields that allow you to define the level of detail for the filter. To apply them, right-click on the calculated field and add it as a filter.
Key Characteristics:
Granular Control: Fixed LOD Filters give you the ability to specify the exact level of detail for a filter. This is particularly useful when you need to apply a filter at a specific level of granularity, regardless of the level of detail in the visualization.
4. Dimension Filters
When They Are Applied: Dimension Filters are applied by dragging a dimension field onto the Filters shelf, which is usually located on the left side of your worksheet.
Key Characteristics:
Categorical Filtering: Dimension Filters help you filter data based on categorical attributes. They are ideal for narrowing down data using non-numeric dimensions like categories, regions, or product names.
Selective Control: You have the flexibility to choose specific dimension values to include or exclude, providing fine-tuned control over your database.

4.1 Include/Exclude Level of Detail (LOD) Filters
When They Are Applied: Include and Exclude LOD Filters are created using calculated fields, and you can access them by right-clicking on the calculated field and adding it as a filter.
Key Characteristics:
Targeted Inclusion/Exclusion: Include LOD Filters allow you to focus on specific dimensions in your analysis, refining your data view. On the other hand, Exclude LOD Filters let you filter out particular dimensions from your analysis.
Logic-Based Filtering: These filters are driven by calculated fields, enabling you to apply complex logic for selective inclusion or exclusion of data.
4.2 Data Blending
When It Is Applied: Data Blending is used to combine data from multiple sources within Tableau. You can access Data Blending settings through the Data menu.
Key Characteristics:
Merging Data Sources: Data Blending is essential when working with multiple data sources, allowing you to combine them into a cohesive view for your visualizations.
Common Dimensions for Blending: Blending occurs via common dimensions shared between the data sources. Tableau automatically identifies these shared elements and blends the data accordingly.
As you move from Dimension to Measure filters, Include/Exclude LOD Filters, and Data Blending, each of these features adds unique capabilities to your analytical approach.
5. Measure Filters
When They Are Applied: Measure Filters are applied by dragging a measure onto the Filters shelf, which opens the Measure Filter window, allowing you to define the range or conditions for filtering.
Key Characteristics:
Numerical Filtering: Measure Filters are used to filter data based on numerical metrics, such as sales, quantity, or profit.
Range and Condition Settings: You can define thresholds, set ranges, and apply conditions to include or exclude specific numerical values, giving you precise control over your data.

5.1 Forecasts
When They Are Applied: Forecasts can be accessed by right-clicking on a measure in your view and selecting the "Forecast" option.
Key Characteristics:
Predictive Analysis: Forecasts allow you to predict future trends by analyzing historical data, offering valuable insights into potential outcomes.
Customizable Settings: You can customize your forecasts by adjusting parameters such as forecast length, confidence intervals, and the forecasting model to better align with your data and analysis needs.
5.2 Table Calculations
When They Are Applied: Table Calculations can be accessed through the drop-down menu on a measure or by right-clicking on a pill in the view.
Key Characteristics:
Advanced Data Analysis: Table Calculations allow you to perform sophisticated computations directly on your data within the context of your visualizations.
Window Functions: Leverage window functions to analyze a specific range of data points in relation to the current data point, providing detailed insights for comparisons and trend analysis.
5.3 Clusters
When They Are Applied: Cluster analysis can be initiated by selecting the "Cluster" option in the Analytics pane, where you can choose the dimensions for clustering and specify the number of clusters.
Key Characteristics:
Identifying Patterns: Clusters are used to recognize patterns by grouping similar data points together, highlighting underlying structures within your data.
Unsupervised Machine Learning: Clustering is a form of unsupervised learning, where Tableau automatically organizes data points into groups based on shared similarities, without the need for pre-labeled data.
5.4 Totals
When They Are Applied: Totals can be added to your view by right-clicking on a measure pill and selecting the "Add Totals" option.
Key Characteristics:
Summarized Calculation: Totals provide an aggregated sum or another specified calculation for a specific dimension or the entire dataset, offering a clear overview of key metrics.
Control Over Granularity: You can adjust the granularity at which totals are displayed, providing greater flexibility in how your data is summarized within the visualization.
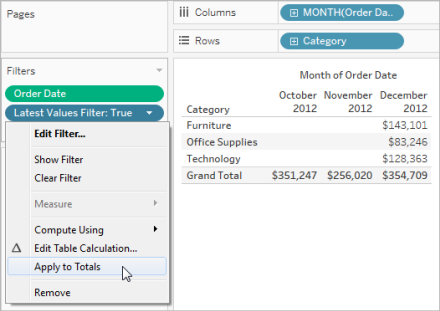
6. Tableau Calc Filters
When They Are Applied: Tableau Calc Filters are created within calculated fields. To apply them, right-click on the calculated field, and select the option to add a filter.
Key Characteristics:
Custom Filtering Logic: Calc Filters enable you to create custom filters based on your own calculated fields, allowing you to incorporate personalized logic tailored to your analysis.
Real-Time Adaptability: As Calc Filters are derived from calculations, they automatically adjust in real time whenever your underlying data changes, offering dynamic flexibility.
6.1 Trend Lines
When They Are Applied: Trend Lines can be added to your visualizations by right-clicking on a measure in your view, selecting the "Trend Lines" option, and choosing the desired type of trend analysis.
Key Characteristics:
Time-Based Insights: Trend Lines offer valuable insights into the time-based progression of your data, making it easier to identify patterns and trends over a specific period.
Customizable Regression Models: You can select from different regression models to fit the trend line to your data, ensuring a more accurate representation of the underlying trends.
6.2 Reference Lines
When They Are Applied: Reference Lines can be added by right-clicking on a specific axis or within the Analytics pane. You can then select from a range of reference line options.
Key Characteristics:
Performance Benchmarking: Reference Lines provide a benchmark for comparison, offering a visual point of reference to assess your data’s performance.
Flexible Customization: You can customize reference lines to represent values such as averages, medians, or any other specific metrics, adapting them to meet your analytical needs.
Final Reflections
Mastering Tableau’s Order of Operations is crucial for effective data manipulation and visualization. By selecting the appropriate tools and features at each step—ranging from data extraction and dimension refinement to advanced analytics and visual enhancements—you can improve dashboard performance and ensure the accuracy of results in your worksheets and dashboards. This process is not just a procedural guide; it serves as a strategic framework that enables users to craft clear and impactful data stories. Navigating this order with skill leads to optimized performance and meaningful insights, ultimately enhancing the art of data exploration in Tableau.


