Early Sepsis Detection with Tableau: A Data Driven Approach Using SBP, DBP, and Mg
Updated: Jan 12
Sepsis is a life threatening condition that is caused by an impaired immune response to an infection. In sepsis, the immune system attacks its own organs. Common symptoms of sepsis are increased heart rate, fever, confusion, fast and shallow breathing, nausea, vomiting and decreased urination. Bacteria, viruses and fungi may trigger sepsis. Some common infections that can trigger sepsis include pneumonia, urinary tract infection, abdominal infection, bloodstream infections.
Sepsis has three stages: sepsis, severe sepsis and septic shock. Septic shock is considered a medical emergency and requires immediate hospitalization in the ICU. Newborns, elderly, diabetics, cancer patients, ICU patients with catheters or ventilators are at higher risk. They are very prone to get sepsis. They all need close monitoring so that we can detect sepsis with early signs. It is very important to detect sepsis as early as possible because in septic shock it is very difficult to cure. Early detection of sepsis increases the survival rate of patients and prevents long-term health problems like organ failure and septic shock. Early detection of sepsis also prevents unnecessary financial expenditure. To detect sepsis early, we need to catch the small changes the patient's body makes before they become seriously ill.
For my analysis, I have used a sepsis dataset which has 1.5 million patient records. This dataset contains hourly lab readings of related biomarkers and also includes demographics and vital signs.
I have chosen SBP (Systolic Blood Pressure), DBP (Diastolic Blood Pressure) and Mg (Magnesium). I have used Tableau's advanced charts, such as dual-axis and heatmaps, to analyze these biomarkers.
First, let's talk about SBP and DBP. The normal range for SBP is less than 120 mmHg, and for DBP it is less than 80 mmHg. I have used a butterfly chart to visualize the dataset with SBP and DBP among sepsis and non sepsis patients. By using a butterfly chart to visualize SBP and DBP side by side, it is a lot easier to find patterns of any kind. This is very helpful for sepsis monitoring.
Calculated field used for SBP ranges–
IF [SBP] < 90 THEN "SBP<90"
ELSEIF [SBP] <= 110 THEN "SBP 90-110"
ELSEIF [SBP] <= 140 THEN "SBP110-140"
ELSE "SBP>140"
END
Calculated field used for DBP ranges–
IF [DBP] < 50 THEN "DBP<50"
ELSEIF [DBP] <= 60 THEN "DBP50-60"
ELSEIF [DBP] <= 80 THEN "DBP60-80"
ELSE "DBP>80"
END
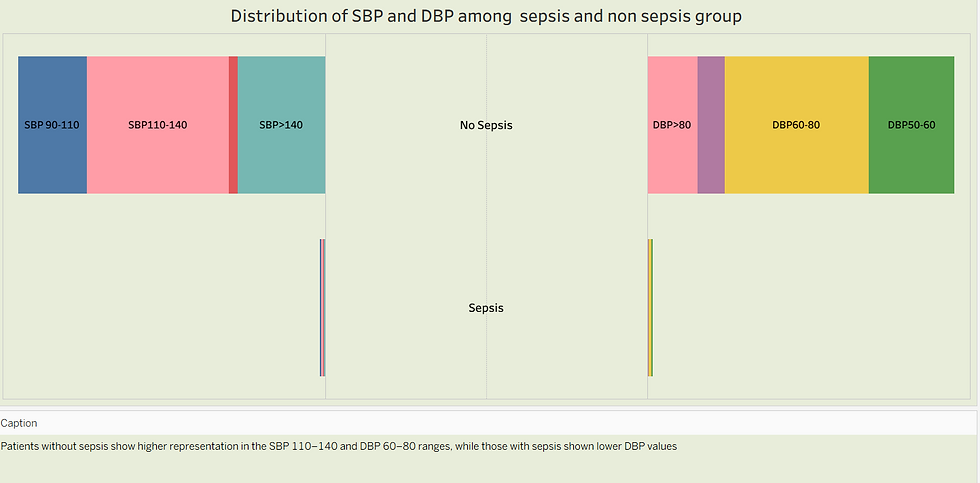
This chart shows that patients with SBP 110-140 are more common in no-sepsis while patients with SBP > 140 are also common in no-sepsis. Patients with DBP 60-80 are more common in no-sepsis, while patients with lower DBP values are common in sepsis.
Now, let's talk about Mg (Magnesium). Normal range for magnesium is 1.7-2.2 mg/dL. Low magnesium (hypomagnesemia) and high magnesium (hypermagnesemia) are highly related to kidney injury during sepsis. Hypomagnesemia occurs during early sepsis, while hypermagnesemia is related to acute kidney injury during late sepsis. Due to this, close monitoring of magnesium levels in patients is very important.
To visualize the distribution of different ranges of Mg among MICU and SICU patients, I used a lollipop chart because it is cleaner than a bar chart, and it is good for comparison.
Calculated field used for Magnesium-ranges–
IF [Magnesium] < 1.6 THEN "Low"
ELSEIF [Magnesium] <= 2.4 THEN "Normal"
ELSE "High"
END

This chart shows that patients in MICU and SICU with hypomagnesemia need close monitoring because they may have early sepsis. If not taken care of, it may lead to acute kidney injury. Patients with hypermagnesemia may have impaired renal systems, meaning that their renal system isn't functioning properly. These patients are at risk of organ failure and need close monitoring.
In next visualization, I tried to evaluate Mg with two other biomarkers- Creatinine and Blood Urea Nitrogen (BUN). Creatinine is a waste product of body that is filtered by the kidney. Sepsis causes acute kidney failure (AKI), leading to a rise of creatinine in the body. Therefore, creatinine is marker for kidney injury. High serum creatinine level reflects kidney stress.
BUN is a measure of the amount of urea nitrogen in the blood. Urea is formed as waste in the liver by the breakdown of proteins, and the kidneys remove waste urea from the blood. BUN is a marker for kidney function.
In sepsis, BUN levels increases in blood because sepsis increases protein breakdown, and at the same time, it damages the kidneys. Kidney damage hinders the BUN filtration and the excretion with urine.
To represent the relationship between Mg, creatinine, and BUN, I have chosen a heat map chart. When using a heat map chart, it is easier to find correlations among two or more variables and it also makes complex data easy to understand by representing it with colors.
Calculated field used for Creatinine -ranges–
IF [Creatinine] < 0.6 THEN "Low"
ELSEIF [Creatinine] <= 1.3 THEN "Normal"
ELSE "High"
END
Calculated field used for BUN -ranges–
IF [BUN] < 7 THEN "Low"
ELSEIF [BUN] <= 20 THEN "Normal"
ELSE "High"
END

This chart unfolds the relation between magnesium, creatinine and BUN. High magnesium, Creatinine, and BUN, may indicate that the patient is at a higher risk to get late stage sepsis or acute kidney injury. Low magnesium and normal or low creatinine and BUN, may indicate that the patient is in stress before kidney damage. In both scenarios, the patients will need close monitoring.
Magnesium is a very important biomarker when monitoring sepsis. Hypomagnesemia reflects renal stress and early sepsis, whereas hypermagnesemia represents late sepsis and acute kidney injury. Monitoring magnesium with creatinine and BUN, will help to look at kidney health more precisely. By monitoring these biomarkers in patients, we can detect septic shock early and save lives.
Finally, I want to thank my tutors, organizers, and my team members for helping me throughout this process.


