Dimensions and Measures in TABLEAU

TABLEAU is a data visualization tool for data analysis. Tableau can connect to and join data from various sources like Excel files, Text files, JSON files.
Once data is imported into Tableau, data can be represented as different charts using
Dimensions and
Measures.
Let’s talk more about what these dimensions and measures are.
Dimensions are the fields or column headings in a data set that provide context to data such as category, Date, Service Type, Region. They are used to slice and categorize data. When you add a dimension, you are creating headers or panes in your visualizations.
Measures are numerical values that can be measured and analyzed such as Profit, Sales, Duration of Stay. When you add a measure to the rows or columns shelf, Tableau by default aggregates the values using aggregate functions like Sum, Count, Average. Aggregation is applied based on the context.
For example, if Sales is added to rows, it is shown as Sum(Sales) which is the total sum of all the sales from all the departments in superstore data. CNT(Sales) represents the total number of rows in sales column. In other words, count represents the number of records available for Sales.
Custom measures can be created using ‘Create Calculated Field’ option. Such measures which use aggregate functions like Count(), Sum() will not be aggregated again when added to the view and shown as AGG(). Otherwise, newly created measures behave just as the measures in the data set.
Dimensions and Measures can be
discrete or
continuous.
Date is a variable that can be both discrete and continuous.
Let’s have a deeper understanding of what a discrete and continuous Date variable will behave like.
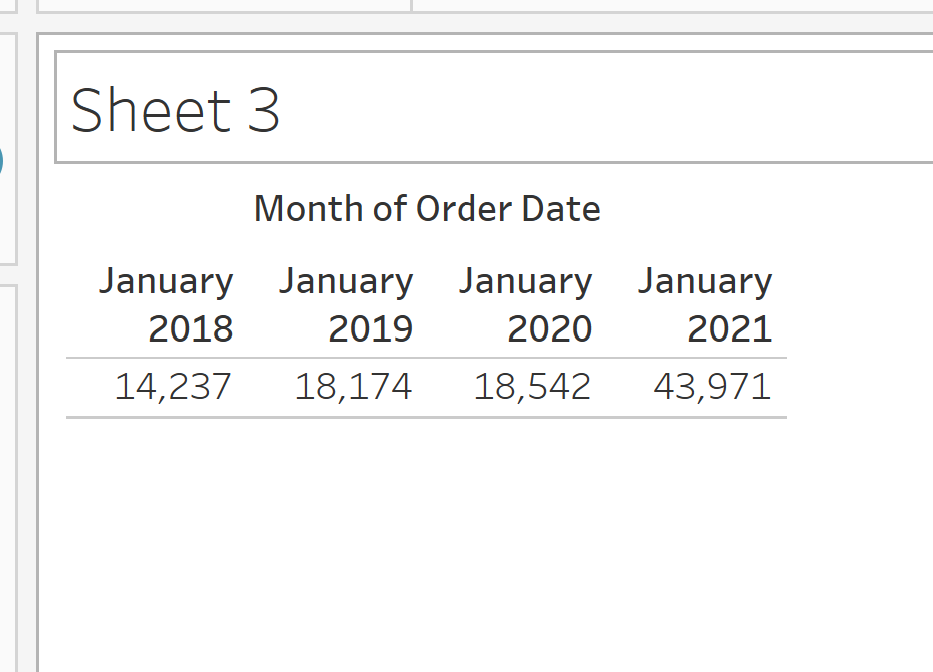
In the SuperStore data set, let us select the discrete Month part (which is the first section of the two). Drag Sales to the Rows. Now, Sales is shown as the sum of sales of January for all the Years(2018 - 2021).

If we select the continuous Month part(which is the second section of the two), Sales is shown for January of each year separately.
When measures and dimensions are dragged to rows and columns in Tableau canvas, Blue means "Discrete" and green means "Continuous".
Tableau visualizes "Discrete" and "Continuous" fields differently.
When should we use fields as discrete and continuous?
use discrete fields (blue) for categorical data like names or categories
use continuous fields (green) for numerical data like sales or dates that can be measured on a scale.
How are these represented visually?
Discrete fields are usually represented as bar graphs, pie charts, tree maps, map charts which show distinct
groups
Continuous fields are usually represented as line graphs, scatter plots, histograms which show trends, distribution or how a field changes over time.
Example:
In the Superstore sample data,
if we want to understand Sales for each category, it can be represented as a Pie chart with Category as a discrete dimension and Sales as a discrete measure.
if we want to understand Sales of a particular category over time, it be represented using
either as a discrete Month for Date and Category Dimensions, Sales as a Measure which show entire sales of particular category in a Month in all the years - line chart where category is put in color.
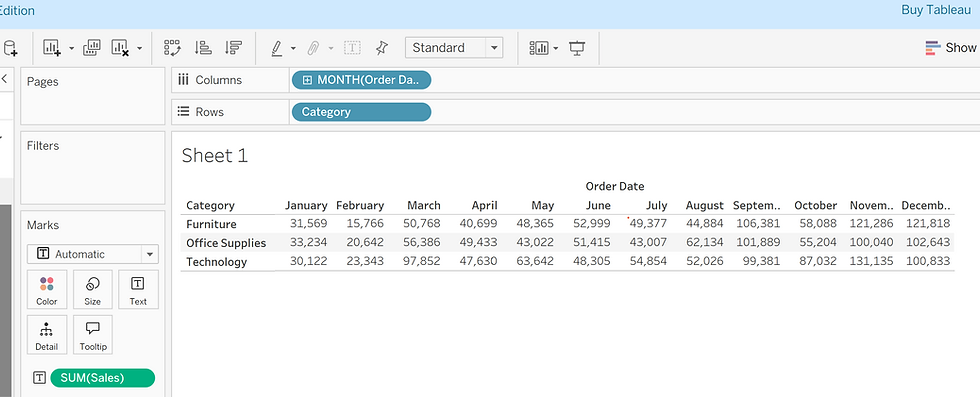
or as a continuous Month for Date Dimension and Sales measure with Category in Color.

Sometimes, you might want to analyze data at a granular level, treating a field that Tableau initially classified as a measure (like "Quantity") as a dimension to see how many items were ordered together with other identical items.
TABLEAU also allows converting measures to dimensions enabling detailed analysis at a granular level.
By converting a measure to a dimension, you can split your view by the values of that field, allowing for comparisons and insights across different categories or groups.
Example: Imagine you have a "Sales" field (a measure) and a "Region" field (a dimension). You might want to see the total sales by region, but also analyze sales by specific product categories, requiring you to treat "Product Category" as a dimension.


