DAX Expressions Explained: Why They’re Not Like Traditional Programming Languages

DAX Stands Data Analysis Expressions in PowerBI. When you come from a programming background; Python, Java, SQL etc, or even Excel formulas! DAX can feel simple or familiar at first and then suddenly confusing. That is because DAX is not a procedural programming language. It’s a functional, context-driven language designed specifically for analytics.
In this blog, we’ll break down:
What DAX really is.
How it differs from traditional programming languages.
Why functions like SWITCH(TRUE()), RANKX, and VAR behave the way they do.
Real-world Power BI examples using healthcare data (BMI, Diabetes, Hypertension etc).

Photo by Markus Spiske on Unsplash What Is DAX?
DAX is the formula language used in:
Power BI
Power Pivot
SSAS Tabular models
Its purpose is not to control program flow, but to calculate values dynamically based on data context, filters, slicers and other parameters.Unlike Python or Java, DAX evaluates expressions based on:
Filters
Relationships
Visual interactions (rows, columns, slicers)
In most programming languages:
Code executes sequentially
Variables store and change values
Loops and conditionals control execution
if bmi > 30:
category = "Obese"
You explicitly tell the program how to run based on stored variables, loops etc
But in DAX:
There are no loops
You do not control execution order
Results depend entirely on context
When you write and run a DAX query; it answers one question:
“Given the current context, what is the correct result?”
This is why the same DAX expression can show different values across visuals.
Row Context and Filter Context :
Two Fundamental concepts in DAX are Row context and Filter context. To understand DAX we must gain full clarity on these two concepts.
Row Context (Calculated Columns)
DAX expression operates in columns. But column reference is a somewhat ambiguous definition because you reference the value of a column in a specific row and the full column itself, both with the same syntax. When you use a column reference to retrieve the value of a column in a given row, you need a way to tell DAX which row to use, out of the table, to compute the value. In other words, you need a way to define the current row of a table. This concept of “current row” defines the Row Context.
You have a row context when:
When you write an expression in a calculated column, the expression is evaluated for each row of the table, creating a row context for each row.
When you use an iterator like FILTER, SUMX, AVERAGEX, ADDCOLUMNS, or any one of the DAX functions that iterate over a table expression.
Row context means DAX evaluates an expression row by row.
This is commonly used in calculated columns, such as BMI classification.
Example: BMI Category
Example: BMI Category
BMI Category =
SWITCH(
    TRUE(),
    DimPatientDemography[BMI] < 18.5, "Underweight",
    DimPatientDemography[BMI] < 25, "Normal",
    DimPatientDemography[BMI] < 30, "Overweight",
    "Obese")
Here, DAX automatically knows:
Which row it is evaluating
Which BMI value belongs to that row
There is no loop; row context handles it implicitly.
Table: DimPatientDemography

Row 1 -> BMI = 22 -> "Normal"
Row 2 -> BMI = 28 -> "Overweight"
Row 3 -> BMI = 35 -> "Obese"
Each row is evaluated independently.
Filter Context (Measures)
Filter context is added when you specify filter constraints on the set of values allowed in a column or table, by using arguments to a formula. Filter context applies on top of other contexts, such as row context. Filter context defines which rows are visible when a calculation runs.
Filter context defines which rows are visible when a calculation runs.
It is created by:
Slicers
Filters
Rows and columns in visuals
Relationships between tables
Example: Average HbA1c
Avg HbA1c =
AVERAGE(FactLabResults[HbA1c])
This measure:
Changes by Gender
Changes by Race
Changes by Diabetic Status
Changes by selected slicers
The formula never changes; only the context does.
[All Patients]
      ↓
[Filter:Diabetic = Yes]
      ↓
[Filter:Female]
      ↓
[Filter:Race = Latino]

-> Avg HbA1c recalculated
Each filter layer reshapes the data before DAX evaluates the expression.

Measures vs Calculated Columns : Not Just a Storage Choice
This is one of the most misunderstood differences.
Calculated Columns
Evaluated once at data refresh
Stored in memory
Use row context
Good for categories, labels, static attributes
Example: BMI Category
Measures
Evaluated on the fly
Not stored
Use filter context
React to slicers and visuals
Example: Average HbA1c
Avg HbA1c =
AVERAGE(FactLabResults[HbA1c])
Same measure → different values per:
Gender
Race
Diabetic status
Visual level
This dynamic behavior does not exist in traditional programming.
Why SWITCH(TRUE()) Is So Common in DAX
In DAX there is a unique function called SWITCH which evaluates and expression against a list of values and returns one of the multiple posible results expression. Now the question arises :
Why do we write SWITCH(TRUE()) ? Why not use IF ELSE condition instead:
There are two main reasons for it:
It allows multiple complex conditions without deeply nested IF statememts
Query looks much cleaners and easy to maintain.
Example: Blood Pressure Classification
I wanted to classify BP based on the 24hour average systolic and diastolic blood pressure range. Since it need to be calculated row wise for each patient i made a calculated column with the below DAX expression.
BP Classification =
VAR SBP = [24-Hour-Average-SBP]
VAR DBP = [24-Hour-Average-DBP]
RETURN
SWITCH(
    TRUE(),
    SBP >= 180 || DBP >= 120, "Hypertensive Crisis",
    SBP >= 140 || DBP >= 90,  "Stage 2 Hypertension",
    (SBP >= 130 && SBP < 140) || (DBP >= 80 && DBP < 90), "Stage 1 Hypertension",
    SBP >= 120 && SBP < 130 && DBP < 80, "Elevated",
    "Normal"
)
It will gives us row wise categorization per patient based on their average sbp and dbp values.

Why this works
TRUE()Returns the logical value TRUE.
Each condition is evaluated sequentially
First TRUE condition wins
This pattern is readable, scalable, and performant—which is why it’s a DAX best practice.
Variables (VAR) in DAX Are Not Memory Containers
In Python or Java, variables store mutable values. In DAX, VAR Stores the result of an expression as a named variable, which can then be passed as an argument to other measure expressions. Once resultant values have been calculated for a variable expression, those values do not change, even if the variable is referenced in another expression.
Improves readability
Improves performance
Does NOT change once defined
Example: Calculating risk score for patients
VAR HbA1c = AVERAGE(Labs[Hb A1C%])
VAR HOMA  = AVERAGE(Labs[HOMA1_IR])
VAR LDL   = AVERAGE(Labs[LDL CALCmg/dL])
VAR CRP   = AVERAGE(Labs[CRP (mg/L)])
VAR Dur   = MAX('DimPatient Medical History'[Diabetes_Duration])
VAR Statin = MAX('DimPatient Medical History'[STATINS])

VAR HbA1cPts = IF(HbA1c >= 6.5, 2, 0)
VAR HomaPts  = IF(HOMA >= 2.0, 1, 0)
VAR LdlPts   = IF(LDL >= 130, 1, 0)
VAR CrpPts   = IF(CRP >= 3, 1, 0)
VAR DurPts   = IF(Dur >= 10, 2, IF(Dur >= 5, 1, 0))
VAR StatinPts = IF(Statin = "Y", -1, 0)

RETURN
HbA1cPts + HomaPts + LdlPts + CrpPts + DurPts + StatinPts
Hence; by using variable VAR <Name> in our DAX formulas can help us write more complex and efficient calculation. It increases readability, performances and reduce complexity.
Ranking in DAX: RANKX vs Loops
In traditional programming, ranking would require:
Sorting
Iteration
Indexing
In DAX:
Age_Rank_Column =
RANKX(
    FILTER(
        ALL('DimPatientDemography'),
        'DimPatientDemography'[Visit_Number] = 2
    ),
    CALCULATE(MAX('DimPatientDemography'[Age])),
    ,
    ASC,
    Dense
)
What’s happening:
ALL() removes filters
RANKX evaluates across the entire table
Context does the heavy lifting
DAX Query View - EVALUATE Keyword
Apart from creating calculated columns and measure using DAX formulas, Dax queries can also be used to directly to check results in runtime usign DAX Query View option. DAX queries have a simple syntax comprised of just one required keyword, EVALUATE. EVALUATE is followed by a table expression, such as a DAX function or table name, that when run outputs a result table.
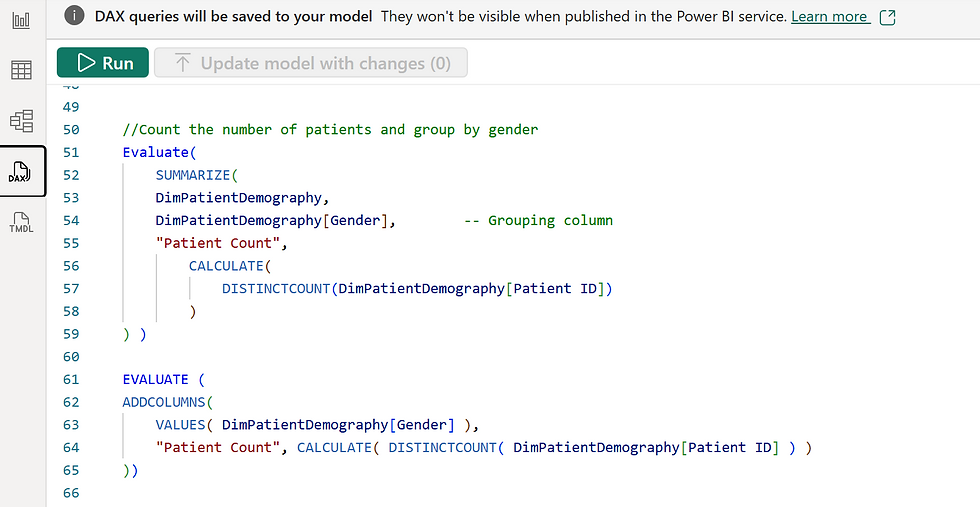
DAX queries return results as a table right within the tool, allowing you to quickly create and test the performance of your DAX formulas in measures or simply view the data in your semantic model.

Why DAX Feels Difficult (At First)
DAX challenges how we think because:
You don’t control execution flow
Results depend on visual context
The same formula behaves differently in different places
But once you shift your mindset from programmer to data modeler, DAX becomes intuitive and extremely powerful.
Final Thoughts
DAX is not meant to replace Python, SQL, or Java. It solves a different problem:
Turning data into real-time, interactive insights through context-aware calculations.
If you understand context, you understand DAX.


