DAX (Data Analysis Expressions) Master: Advanced Analytics for Microsoft Power BI
- Naseema Halidh
- Jan 15, 2025
- 8 min read


What is Power Bi
Power BI is a Business Intelligence (BI) tool made by Microsoft. Its user-friendly interface, combined with advanced capabilities like DAX (Data Analysis Expressions) and Power Query, makes it a preferred choice for professionals across industries.
What is DAX in Power BI?
Data Analysis Expressions, or DAX for short, are expressions and formulas for analyzing and calculating data. Expressions like this are made up of various parts, such as functions, operators, and constants, all combined into a single formula and evaluated to provide a result (value or values). Power BI and other BI tools make excellent use of the data at their disposal, and the DAX formulae they contain are a big reason.
DAX is what’s known as a “functional language,” meaning that every bit of code written in it is a function. Conditional statements, nested functions, value references, etc., can all be part of a DAX expression ready for execution.
DAX formulas can work with two basic data types: numeric and non-numeric or others. Integers, decimals, currencies, etc., are all examples of the numeric data type. Strings and binary objects make up the non-numerical category.
Evaluating DAX expressions begins at the innermost function and progresses to the outermost function. Consequently, it is crucial to develop a DAX formula.
When a DAX formula is executed, it will convert any values of a different data type than the one it was created for. The DAX formula will automatically cast the output values to the specified data type.
Why is DAX Important?
Data Transformation: Simplifies reshaping and transforming data for better analysis.
Dynamic Calculations: Enables real-time updates and calculations in response to user inputs or slicers.
Advanced Analytics: Handles complex business scenarios with ease, such as year-to-date comparisons and cumulative totals.
How To Use DAX
DAX (Data Analysis Expressions) is a powerful formula language used in Microsoft Power BI, Excel, and other tools like SQL Server Analysis Services (SSAS) to create custom calculations, analyze data, and build dynamic reports. :

If you are looking to step into DAX function ,here are the steps to load the file:
1. Open Power BI Desktop: Launch Power BI Desktop on your computer.
2. Get Data: Go to the Home tab on the ribbon. Click on Get Data. From the dropdown, select Excel. (You can also choose Text/CSV if your dataset is in CSV format, but for Excel files, select Excel).
3. Choose Your File: A file dialog will appear. Navigate to where you have stored the Superstore dataset (it could be an Excel file like Superstore.xlsx). Select the file and click Open.
4. Navigator Window: Once you open the file, Power BI will display a Navigator window showing the tables/sheets available in the Excel file.
5. Select the tables you want to load: Typically, for the Superstore dataset, you would select tables such as Orders, Products, Customers, Regions, etc.
6. Load Data: Power BI will now load the selected tables into the model. The tables will appear in the Fields pane on the right side of Power BI.
7. Verify Data: To make sure everything is loaded correctly, you can click on the tables in the Fields pane to view the data and confirm the load.
finally you will get the output like this

Next We Have To Create relationship
Go to the Model View
After loading the data, switch to the Model view by clicking the Model icon on the left sidebar (it looks like a diagram or flowchart).
Create Relationships Automatically (Power BI Can Auto-Detect)
Power BI will try to detect relationships automatically. You will see lines between the tables that indicate these relationships. However, you may need to refine or manually adjust these relationships.
Manually Create Relationships
If Power BI doesn't automatically detect all relationships or if you need to customize them, follow these steps:
In Model View, click on a table and drag a field from that table to a corresponding field in another table.
Define Relationship Settings
When you drag and drop to create a relationship, a dialog box will appear. You can adjust the following:
Cardinality: The relationship type between the tables:
One-to-Many (1:*): One record in the first table (e.g., Customers) relates to many records in the second table (e.g., Orders).
Many-to-One (*:1): Many records in the first table relate to one record in the second table.
Many-to-Many (:): Multiple records in both tables can relate to each other (not common but can be used in certain scenarios).
Cross Filter Direction: You can choose between Single or Both directions. Generally, you can set it to Both for tables that need to filter each other, like Orders and Products.
Active Relationship: Power BI allows you to have multiple relationships between two tables but only one active relationship. You can change the active relationship by selecting the relevant checkbox.
Verify Relationships
After creating the relationships, you should check that the lines between the tables are connected correctly. You should have clear one-to-many relationships (represented by a line with a “1” on one side and a “*” on the other).
Ensure there are no circular dependencies or orphaned tables (tables that are not connected to others).

Next we will see the DAX function:
Aggregation and Summarization
DAX enables users to summarize and aggregate data dynamically, providing quick insights into key metrics.
SUM(): Adds values in a column.
DAX Formula:
You can create a simple measure in DAX to calculate the Total Sales.
Total Sales = SUM(Order[Sales])Visualization:
To visualize Total Sales, you can use a Card Visualization in Power BI:
Create a Card visualization from the Visualizations pane.
Drag the Total Sales measure (created with DAX) into the Values field of the card.
The card will display the Total Sales across all records in your data.
Result: The card will show the sum of all Sales Amount in the dataset.

AVERAGE(): Calculates the average of values in a column.
Average Sales = AVERAGE(order[Sales])To visualize Average Sales per Product:
Select a Bar Chart or Column Chart from the Visualizations pane.
Drag the Product field to the Axis field.
Drag the Average Sales measure into the Values field.
Power BI will show a bar chart with the Average Sales for each product.

COUNT(): Counts the number of non-null values in a column.
To count the number of products sold, use the COUNTROWS() function in DAX
Products Sold Count = COUNTROWS(Sales)
Time-Based Analysis (Time Intelligence)
DAX includes several time intelligence functions that allow you to perform calculations across time periods such as year-to-date (YTD), month-over-month (MoM), and year-over-year (YoY).
TOTALYTD(): Calculates the total for the year up to a specific date.
TOTALYTD(<Expression>, <Dates>, [<Filter>], [<Yearend Date>])SAMEPERIODLASTYEAR(): Compares data from the same period in the previous year.
SAMEPERIODLASTYEAR(<Dates>)DATEADD(): Shifts the date context by a specified number of periods (days, months, years).
DATEADD(<Dates>, <NumberOfIntervals>, <Interval>)Conditional Calculations
DAX provides logical functions to create conditional calculations based on specific criteria. These are helpful when you need to categorize or filter data.
IF(): Evaluates a condition and returns one value if true and another if false.
IF(<Condition>, <Result_If_True>, <Result_If_False>)SWITCH(): Evaluates multiple conditions and returns the corresponding result for the first match.
SWITCH(<Expression>, <Value1>, <Result1>, <Value2>, <Result2>, ..., <Else_Result>)IFERROR(): Returns a value if the expression is an error, otherwise returns the result of the expression.
IFERROR(<Value>, <Value_If_Error>)Filter and Context Manipulation
DAX allows users to create dynamic filters within their calculations, modifying the context of a formula based on selected slicers or report filters.
CALCULATE(): Modifies the context of a calculation by applying filters.
CALCULATE(<Expression>, <Filter1>, <Filter2>, ...)FILTER(): Returns a table that has been filtered by a given condition.
FILTER(<Table>, <Condition>)ALL(): Removes all filters on a column or table.
ALL(<Column/Table>Custom Metrics and Key Performance Indicators (KPIs)
With DAX, you can create custom metrics and KPIs based on business logic. These could include financial ratios, profitability metrics, or performance indicators.
Creating custom KPIs: You can define performance indicators like profit margin, customer lifetime value, or inventory turnover.
Relationships Between Tables
DAX can be used to manage relationships between tables in your data model. By using DAX, you can perform calculations that span multiple tables, ensuring that your analysis can handle complex data models.
RELATED(): Retrieves a value from a related table.
RELATED(<Column>)RELATEDTABLE(): Returns a table that is related to the current row
RELATEDTABLE(<Table>)Calculated Columns and Measures
DAX can be used to create calculated columns and measures in Power BI.
Calculated Columns: These are computed row-by-row during the data refresh and stored in the model. They are static until the data is refreshed.
When you use the calculated columns, a new column will be added to your table. A calculated column is identical to any other column, except that it must contain at least one function. You can use them to make a filtered or sorted column in your table.
Steps to Create the Calculated Columns
1. Turn on the Power BI Desktop
2. In the Power BI Desktop left pane, select the Data tab.

Next, click the New Column button

In the Formula bar enter the code
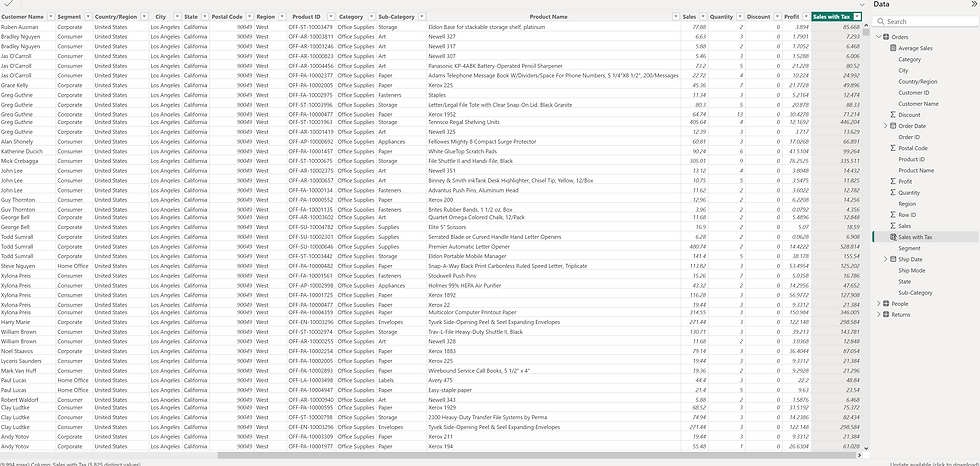
Sales with Tax = Sales[Amount] * 1.10click enter
next, click on the table icon on left you will see the new column created on name sales with tax
Calculated Measures.
A field with consolidated data (a total, proportion, percent, mean, etc.) is generated by a calculated measure.
Measures: These are dynamic calculations that respond to slicers and filters in a report.
Steps to Create the Measure
Next, choose the “New Measure” menu item.

The words “Measure =” will appear in a Formulas window.

You can change “Measure” to any other name for a unit of measurement.

Sum Of Sales = SUM(Sales[Amount])choose the visualization you want to display the Sum Of Sales
Row Context vs. Filter Context
One of the key features of DAX is its handling of Row Context and Filter Context:
Row Context: Occurs when a DAX expression is evaluated for each row in a table (e.g., in calculated columns).
Profit = order[Sales] - Sales[Cost]Filter Context: Occurs when filters (such as slicers or report filters) modify the data considered for a calculation (e.g., in measures).
Total Sales = SUM(order[Sales])Nested Calculations and Variables
DAX allows you to store intermediate calculations in variables using the VAR keyword. This helps improve performance and readability.
Key Benefits of Using Variables
Improved Readability: Makes complex formulas easier to understand.
Reusability: Reduces redundant calculations by storing values in variables.
Performance: Optimizes the execution of DAX queries.
syntax for variable
MeasureName = VAR VariableName = CalculationExpression
RETURN FinalExpression
Data Aggregation Across Multiple Tables
When you have data spread across multiple related tables, DAX allows you to perform aggregation across those tables.
SUMX(): Performs a sum of an expression evaluated row by row over a table.
AVERAGEX(): Similar to SUMX(), but for averaging.
FILTER(): To filter data across multiple tables and create complex aggregations.
Hierarchical Calculations
DAX is also useful when dealing with hierarchical data, such as dates, regions, or organizational structures. You can use DAX functions to navigate these hierarchies and perform aggregations at different levels.
PATH(): Returns a delimited text string representing the hierarchy of a given member.
EmployeeHierarchy = PATH(Employee[EmployeeID], Employee[ManagerID])RELATED(): Helps in traversing relationships between hierarchical levels.
RegionName = RELATED(Region[RegionName])Conclusion
Learning and mastering DAX, Data Analysis Expressions, in Power BI is a must for those looking to move beyond visualization and into truly sophisticated data analysis and visualization. DAX is a formula language used within Power BI to derive calculated fields, measures, and more. As you master advanced DAX functions, you unlock the true potential of your data and are able to transform raw data into actionable intelligence, leading to better decision-making and overall improved business outcomes.
Ultimately, the proficiency in DAX empowers analysts and business professionals to handle complex data scenarios, perform in-depth time intelligence analysis, and develop dynamic reports and dashboards that cater to diverse business needs. The learning curve for DAX may seem steep at first, but with consistent practice, the rewards in terms of efficiency and analytical capability are substantial.