Data Normalization Using SQL, Power BI, Python and Excel

Imagine you have a messy box of toys. Some toys are repeated, some are broken, and some are all mixed up. You want to organize them so that everything is easy to find and use.
That’s exactly what data normalization does for information.
Data Normalization:
Normalization means:
Cleaning data
Reducing duplicates
Making information consistent
Splitting big messy tables into smaller, neat ones.
Think of data normalization like organizing your home.
SQL → putting toys in separate labeled boxes
Power BI → lining toys up so each row is one toy
Python → either organizing the toys or scaling them so they fit nicely on the shelf
Excel → cleaning, separating, and aligning toys neatly on shelves
Normalization in SQL:
SQL stores data in tables. Instead of repeating information, we separate it into related tables.
Example:
Messy table:
Student | Grade | Subject | Teacher |
Alice | 10 | Math | Mr. Smith |
Alice | 10 | English | Mrs. Johnson |
Bob | 11 | Math | Mr. Smith |
Step 1: Split into tables
CREATE TABLE Students (
StudentID INT PRIMARY KEY,
Name VARCHAR(50),
Grade INT
);
CREATE TABLE Subjects (
SubjectID INT PRIMARY KEY,
SubjectName VARCHAR(50),
Teacher VARCHAR(50)
);
CREATE TABLE Enrollment (
EnrollmentID INT PRIMARY KEY,
StudentID INT,
SubjectID INT,
FOREIGN KEY (StudentID) REFERENCES Students(StudentID),
FOREIGN KEY (SubjectID) REFERENCES Subjects(SubjectID)
);
· Each piece of info is stored once.
· Easy to update: If Mr. Smith changes, you only change it in one place.
2. Normalization in Power BI
Normalization in Power BI means each row should describe just ONE thing.
One row = one event, one transaction, or one record
No combining multiple values in the same row.
Messy table:
Student | Math | English |
Alice | 95 | 88 |
Bob | 80 | 90 |
Step: Unpivot columns
Student | Subject | Score |
Alice | Math | 95 |
Alice | English | 88 |
Bob | Math | 80 |
Bob | English | 90 |
· Each row is one piece of information
· Easier to build charts, graphs, and calculations
3. Normalization in Python
Python has two main ways to normalize:
a) Organize data (like SQL)
import pandas as pd
data = {
'Student': ['Alice', 'Alice', 'Bob'],
'Subject': ['Math', 'English', 'Math'],
'Teacher': ['Mr. Smith', 'Mrs. Johnson', 'Mr. Smith']
}
df = pd.DataFrame(data)
students = df[['Student']].drop_duplicates()
subjects = df[['Subject', 'Teacher']].drop_duplicates()
· Reduces duplicates, separates info into clean tables
b) Scale numeric data (Min-Max normalization)
from sklearn.preprocessing import MinMaxScaler
import pandas as pd
data = {'Score': [80, 90, 95]}
df = pd.DataFrame(data)
scaler = MinMaxScaler()
df['Score_Normalized'] = scaler.fit_transform(df[['Score']])
print(df)
Output:
Score | Score_Normalized |
80 | 0.0 |
90 | 0.5 |
95 | 1.0 |
· All numbers are now on the same scale (0 to 1)
· Useful for graphs, comparisons, and machine learning
4.Normalization in Excel (Most Common Tool!)
Excel normalization is mostly about cleaning and structuring data properly.
Student | Subjects | Scores |
Alice | Math, English | 95, 88 |
Bob | Math | 80 |
Problems:
Multiple values in one cell
Hard to analyze
Charts won’t work properly
Normalized excel table:
Student | Subject | Score |
Alice | Math | 95 |
Alice | English | 88 |
Bob | Math | 80 |
In Excel, normalization is mostly about cleaning and restructuring data so it’s easy to analyze. You start by removing duplicates using Data → Remove Duplicates to ensure the same information isn’t repeated again and again. When multiple values are packed into one cell, you can split columns using Text to Columns so each value gets its own place. For more advanced cleaning, Power Query helps by unpivoting columns, which turns wide, messy tables into clean, row-based data where each row represents just one record. Finally, you can separate data into different tables like Students, Subjects, and Scores, instead of keeping everything in one big sheet. When Excel data is normalized this way, each row tells a single clear story, formulas become simpler and more reliable, and Pivot Tables work faster and give much better insights.
Tool | How Normalization Works | Why It Helps |
SQL | Split into tables + keys | No duplicates, easy updates |
Power BI | Unpivot & structure rows | Clean visuals, better measures |
Python | Split tables or scale numbers | Consistency, ML-ready data |
Excel | Clean, unpivot, remove duplicates | Easy analysis & reporting |
Data normalization simply means keeping your data tidy, clean, and well organized. When data is organized properly, it avoids repeated information, reduces mistakes, and saves storage space. Clean and structured data also makes analysis, visualization, and reporting much faster and easier. Whether you use SQL, Power BI, Python, or Excel, the idea of normalization stays the same—only the way you apply it changes from tool to tool.
Think of normalization like organizing your toys:
One toy per box → SQL (each table has a clear purpose)
Line them up neatly → Power BI (one row equals one record for easy visuals)
Resize or group them for easy comparison → Python (scaling and structuring data)
Clean, sort, and arrange toys on shelves → Excel (remove duplicates, split columns, and use Power Query to keep data tidy)
No matter the tool, the goal is always the same: make data easy to understand, easy to manage, and easy to use.
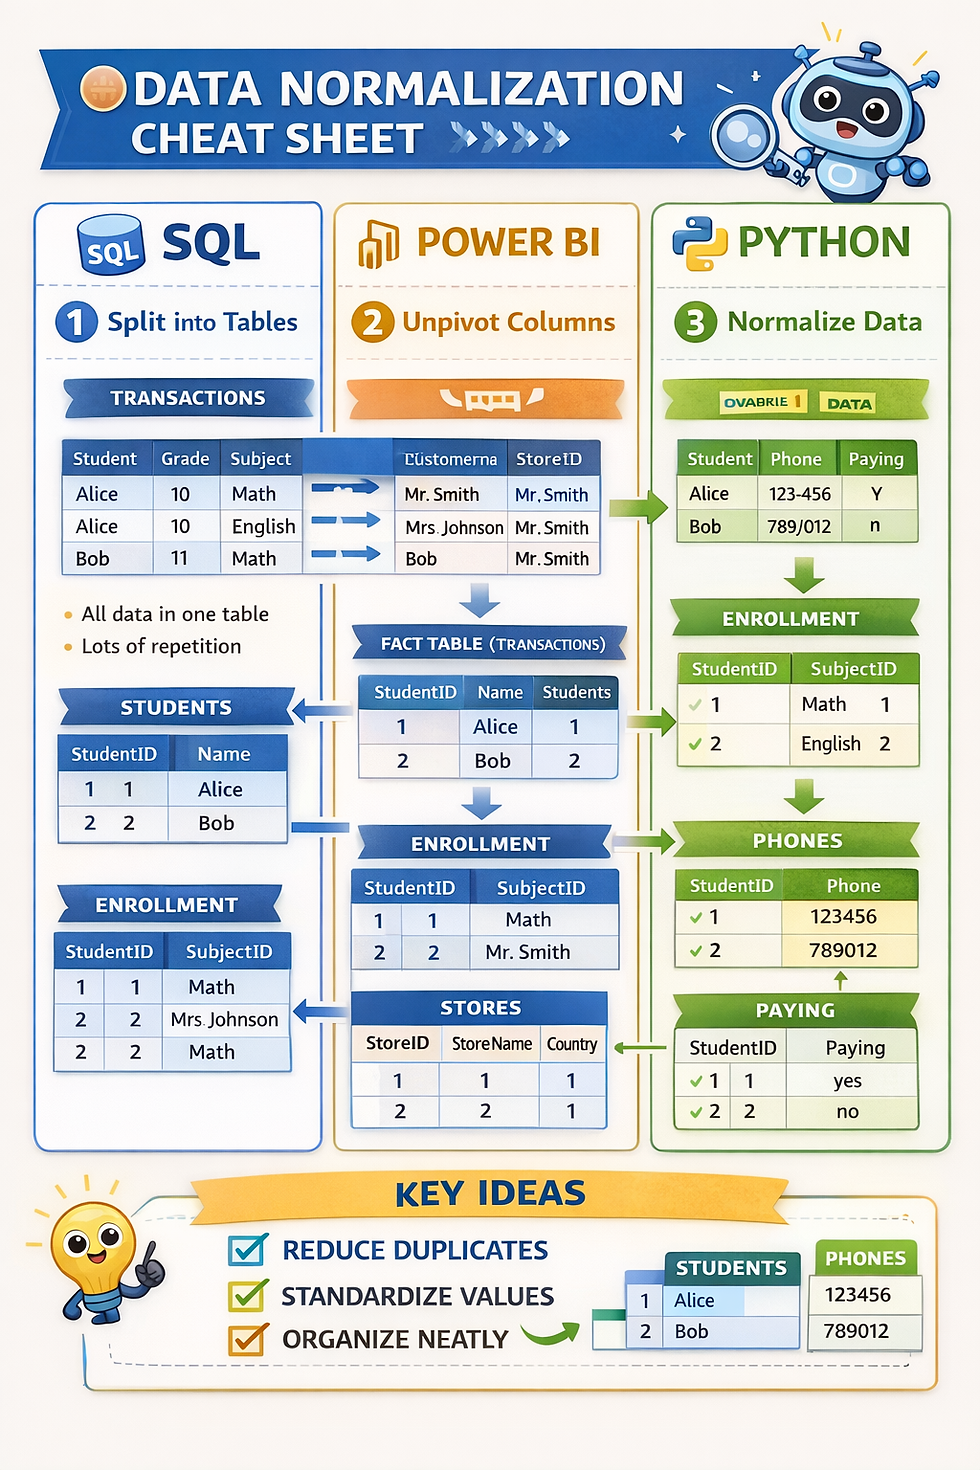
Image Source:Google


