Data Cleaning of Diabetic Dataset
- Nivetha R
- Sep 3
- 4 min read

Let’s see how to clean the diabetic dataset (HUPA-UCM Diabetes Dataset - Mendeley Data)
We are going to use the following steps to clean and transform the dataset that sufficient for Data Analysis.
· Removing Duplicate
· Fixing Structural Errors
· Filtering Outliers
· Convert Data Types
· Remove Unnecessary or Duplicate Features
· Validate Data Accuracy
· Keep Data Format Uniform
· Document Cleaning Process
Removing Duplicate
To remove duplicates, we first checked if there were any duplicate rows in the dataset. After running the check, we found that there are no duplicates, and all the rows are unique. This means each record in the dataset is different and there’s no repeated information. So, we don’t need to remove anything at this step. This helps make sure our analysis is based on clean, accurate data.

If we had any duplicated values in the dataset, the code below would help remove them. It checks for repeated rows and keeps only the first occurrence, removing the rest. This helps keep the data clean and avoids counting the same information more than once.

Fixing Structural Errors
We have date and time information stored together using a timestamp format. To make it easier to read and use, we split it into two separate columns: one for the date and another for the time in 12-hour format (like 2:30 PM). This makes the data more readable and user-friendly. It also helps when we want to filter, sort, or group data by date or time separately. Having clear and clean time information is useful for better analysis and visualization.

So, this process gives us the date in the format %Y-%m-%d, which looks like 2025-09-02 (Year-Month-Day), and the time in the 12-hour format %I:%M:%S %p, which looks like 12:42:50 PM (Hour:Minute:Second AM/PM). This makes the data easier to read and work with for reports, charts, or filtering by specific dates or times.
Filtering Outliers
Filtering outliers means removing values that are outside a normal or realistic range, values that don’t make sense in real life. These could be errors, like a heart rate of 500 bpm or negative steps. Removing them helps improve the quality of the data and makes sure the analysis is based on accurate and meaningful information.

We removed outliers by keeping only values that are realistic in real life:
Glucose: 40–600 mg/dL to avoid extreme or incorrect readings
Heart rate: 30–220 bpm, which is a normal range for humans
Steps: 0–50,000, a possible range for daily activity
Calories: Should be 0 or more — negative values don’t make sense
Carb input: 0–500g, which is typical for daily intake
Basal rate: 0–5 U/hr, based on common insulin pump settings
Bolus volume: 0–20 U, which is a usual range for mealtime insulin doses
Convert Data Types
We convert values like heart rate and steps into whole numbers because they don’t need decimals, while things like insulin doses stay as decimals for better accuracy. We also turn text values like gender and race into categories, which helps save memory and makes the data faster to process.
Rounding numbers helps make the data easier to understand. For example, we round insulin doses to two decimal places and calories to whole numbers. This removes unnecessary detail and keeps the data clean, simple, and more realistic.
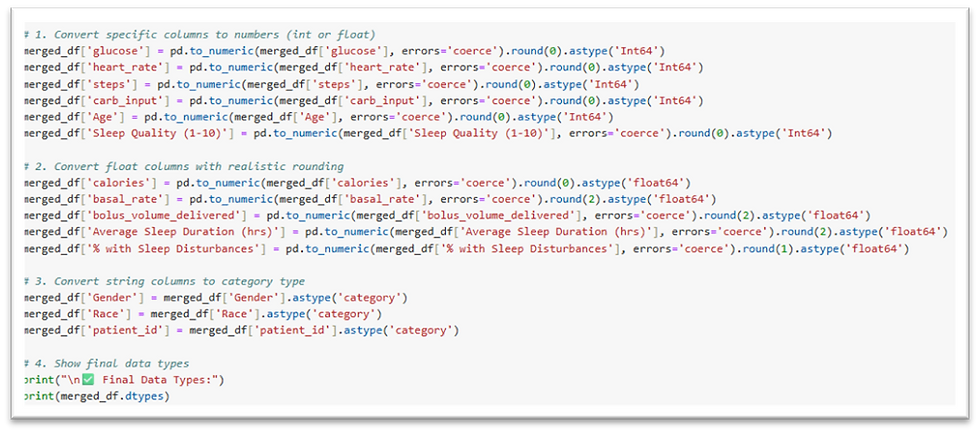
This displays the data types of each column in the dataset. It helps us understand what kind of data we’re working with, like whether a column holds numbers, text, dates, or categories.

Remove Unnecessary or Duplicate Features
Removing unnecessary or duplicate features means deleting columns that don’t provide useful information or repeat the same data. This makes the dataset smaller, cleaner, and easier to work with.
The code below will help you drop these unwanted columns from your dataset.

This helps keep only the columns we need and removes everything else.


We can choose to use either one of these methods, depending on what fits best for our data and goals.
Validate Data Accuracy
Validating data means making sure the values in your dataset are correct and make sense. For example, checking if heart rates are within normal human limits or if the dates are real and not in the future. This helps ensure your data is reliable before you analyze it.

Keep Data Format Uniform
It means making sure all the data looks consistent and neat. First, we change all column names to lowercase so they’re easier to work with. Then, we remove any parentheses and the text inside them to keep the names simple. We also rename columns that start with special characters like % to cleaner names. Finally, we put the columns in a logical order that makes sense for analysis. Doing this helps keep the dataset organized and easier to understand.

Document Cleaning Process
We need to write down the data cleaning steps because:
It helps me to remember what I did in the dataset.
It guides me to do the same steps again later.
It makes finding mistakes easier if something goes wrong.
It helps my team understand the work and avoid confusion.
It shows others that my data is clean, and my results are trustworthy.


