Constructing a Star Schema Structure in Excel Through Power Query
Most people think of Excel as a simple spreadsheet tool, but with the right structure, it can function as a lightweight data‑modeling environment. Whether you are trying to bring order to messy datasets, organizing a workflow for recurring reports, or preparing data for Power BI, building a schema‑like model in Excel can dramatically improve clarity, consistency, and downstream performance.
This blog walks you through how to design a clean, schema‑driven structure in Excel using fact tables, dimension tables, relationships, and validation techniques—without relying on any advanced tools. By the end, you will know how to transform a flat workbook into a well‑organized model that mirrors the principles of a Star Schema.
A natural question arises, ‘Why build a schema model in Excel at all?’A well‑designed schema reduces duplication and inconsistencies, makes data easier to audit and maintain, and improves the overall clarity of your dataset. It also prepares your workbook for seamless import into tools like Power BI and Tableau. All of this becomes even more powerful when combined with Power Query in Excel.
Power Query is Excel’s built‑in ETL engine, a tool that quietly transforms complex, messy data into clean, structured, analysis‑ready tables. One of its greatest strengths is that it supports you normalize the data. Normalization restructures a flat, repetitive dataset into organized tables that eliminate redundancy, improve accuracy, preserve integrity, and make reporting far more reliable. And with Excel’s Data Model, you can load and compress large datasets without worrying about worksheet row limits.
I learned this firsthand while working on a recent project involving a maternal health dataset. On paper, the dataset looked harmless with just 272 rows. But the moment I opened the file, I realized the real challenge was not the number of records but it was those 115 columns packed into a single, sprawling table.
If you have ever worked with a wide dataset, you know the feeling. Scrolling left and right feels like a workout. Columns blur together. You lose track of which fields belong together. And even though the dataset was already in First Normal Form (1NF), meaning every cell contained a single atomic value, the sheer width made it difficult to manage, analyze, or even understand it immediately.
That’s when I decided to normalize it and turn it into a star schema data model using Power Query. What follows is the exact process I used, along with the lessons I learned along the way.
Before diving into the steps, let’s understand why normalization was necessary.
Even though the dataset was technically in 1NF with no grouped values, no comma‑separated lists, no repeating blocks but it still holds the information that maybe labelled as:
Redundant descriptive fields repeated across rows
Inconsistent naming patterns
Columns that belonged to different logical entities
Difficulty in isolating related attributes
A complicated structure that made analysis harder
All such data could have led to problems during insert, update and Delete operations and while generating the reports.
Normalization is not just about removing repeated groups. It is also about organizing data into meaningful tables, so each table represents one concept clearly. It also helps in standardizing the data by organizing tables and forming relationships, it ensures that the stored data is in consistent and uniform manner. All of which makes it easier to update and retrieve data.
In my case, the dataset could logically be broken into twelve smaller separate tables, each representing a different entity or dimension. But getting there required patience, structure, and a lot of scrolling.
Step 1: Load the Data into Power Query
I began by loading the CSV file into Power Query. This is one of the safest places to reshape data without risking accidental overwrites.
Go to the Data tab
Select Get Data → From File → From Text/CSV
Choose the dataset
Click Transform Data
Power Query opened with the full 115‑column table, providing a clean workspace to begin the normalization process.
Step 2: Duplicate the Query for Each Target Table
Since the dataset needed to be broken into twelve separate tables, I duplicated the main query twelve times.
Right‑click the query name
Select Duplicate
This step is foundational, though it sounds simple. Each duplicate acts as a sandbox where you isolate a specific set of fields without touching the original data or affecting the other tables.
By the time I finished duplicating, I had twelve identical queries lined up, each waiting to be shaped into a dimension or fact table.
Step 3: Isolate Columns for the First Table
This is where the real work began.
With 115 columns, simply identifying which fields belonged together required careful scrolling and attention. I held down Ctrl and selected the columns relevant to the first table, in this case, the fact table.
Once the correct columns were highlighted:
Right‑click the selection
Choose Remove Other Columns
This instantly trimmed the query down to only the fields I needed.
It’s worth noting that Power Query also offers the opposite option, ‘Remove Columns’ but because there’s no Undo button, removing the wrong columns can be risky. Removing “other” columns is often safer when you know exactly what you want to keep.
Step 4: Establish a Primary Key for the Fact Table
The fact table contained a column called case_id, which I identified as a potential primary key. But before treating it as such, I needed to ensure that each case_id was unique.
To validate this:
Go to the Home tab
Select Remove Rows → Remove Duplicates
This left me with 272 unique ‘case_id’ values, confirming that the field could reliably serve as the primary key.
This step is crucial in normalization. A fact table without a stable primary key becomes difficult to reference, validate, or join with other tables.
Step 5: Validate the Cleanup Using Column Profile
To doublecheck that the duplication worked:
Go to the View tab
Enable Column Profile
This feature displays statistics for the selected column, including:
Count
Distinct values
Unique values
Error counts
Empty values
Seeing 272 distinct and unique values for case_id confirmed that the operation was successful and that the fact table was structurally sound.
Step 6: Rename the Table for Clarity
On the right side, under Properties, I renamed the query to something meaningful.
Clear naming conventions are essential when working with multiple tables. They make the model easier to navigate and reduce confusion later.
Step 7: Repeat the Process for All Remaining Tables
With the fact table complete, I repeated the same steps for the remaining eleven tables:
Duplicate
Isolate relevant columns
Remove duplicates
Validate
Rename
Each table became smaller, cleaner, and more focused. What started as a single overwhelming sheet gradually transformed into a structured set of tables, each representing a single concept.
The essence of normalization is clarity, one table dedicated to one purpose.
Step 8: Load the Normalized Tables Back into Excel
Once all twelve tables were ready:
Go to Home → Close & Load
Load each table into Excel.
The result was a clean, organized workbook with twelve well‑defined and distinct tables instead of one unwieldy 115‑column sheet.
Now, only the only task remains and that is linking the tables. That can be achieved by selecting a primary key from table to the foreign key of dimension table. After finishing this, a diagram was formed which is known as Star Schema and is often the best practice for data analytics. Fact table is located at the center surrounded by dimension tables connected via ‘1 to Many (1: *)’ relationship.
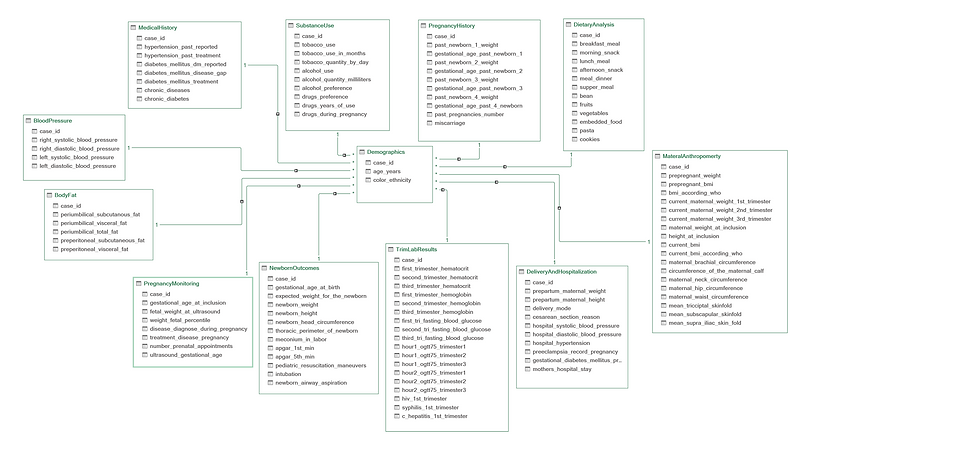
Normalizing this dataset was not just a technical exercise. It was a reminder of how powerful Power Query can be, even for small datasets. The transformation from one wide, hard‑to‑navigate table into twelve clean, structured tables made the data easier to understand, maintain, and analyze.
And the best part?The entire process is repeatable. If the source file updates, Power Query can refresh all twelve tables with a single click.
Normalization is not just about following rules. It is about creating clarity, reducing redundancy, and giving your data a structure that works for you and not against you.


