CLEANING DATA USING POWER QUERY EDITOR
Power Query is a powerful ETL tool used to extract, transform, and load data from various data sources. It is particularly useful for data analysts and data scientists, as it automates daily tasks.
Power Query is an intituve interface used within Excel and Power BI. It enable
users to connect to various data sources, clean and transform data, and automate repetitive tasks.
The interface includes a ribbon with various parts, including queries, data,
query settings, and profiling.
UNDERSTANDIND THE INTERPHASE
There are multiple ways of going to power Query Editor
one is clicking on transform data
From a ribbon view. click directly to power query editor.
During Data Import: When using the Get Data option to import data (e.g., from Excel), you’ll see an option to Transform Data after previewing the source this opens Power Query Editor directly.
Main purpose of power query is extracting data from sources where you can load the data,clean the data and transform the data

Understanding the Interface:
The Power Query Editor window consists of several key sections:
Ribbon Menu: Contains tabs such as Home, Transform, Add Column, View, Tools, and Help.
Queries Pane: Displays all loaded queries.
Data Preview Pane: Shows a preview of the data you are working on.
Query Settings: Allows you to see applied steps and configure each query.
Let’s understand cleaning with order dataset
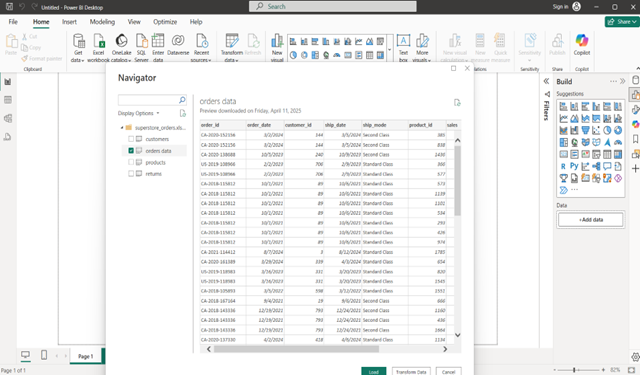
first go to get data. select excel from data sources and select order data from your system .
click on transfer data it will take you directly to query editor you can see this in below picture
Home Tab Function
Key options in the Home tab include:
home button menu of power query you can see option like new source, recent source enter data, manage parameter, refresh preview choose & remove column, keep and remove rows, split column group by, merge and append query, replace value, advance editor, datatype
New Source / Recent Source: Load data from different or previously used sources.
Enter Data: Manually create a new table by typing data.
Refresh Preview: Reload data preview from the source.
Remove Columns / Keep Columns: Selectively remove or retain specific columns.
Remove Rows: Remove blank or null rows using options like Remove Blank Rows.
Split Column: Divide a column based on a delimiter (e.g., comma, space).
Group By: Aggregate data based on selected columns.
Merge Queries: Combine tables using column-based relationships (like SQL joins).
Append Queries: Stack data from multiple tables row-wise (e.g., combining data from 2020, 2021, and 2022).
Replace Values: Replace specific text or values across a column.
Advanced Editor: View and edit the underlying M code for more control.
The Advanced Editor allows access to the M language code generated by Power Query. It’s useful for customizing queries, reusing code, or troubleshooting transformations
at a deeper level.
Understand Append with following Example
suppose we have three years of data like 2020,2021,2022 and we have to append
that data
we use append query then we will get 2020 to 2022 data together in same table
merge query work on column level based while append query work on row level
here we are going to Merge country and order_id column into a new column
called Order_id_new.
Go to transform tab ,click merge column , select separator custom ,
add hypen(_), give new column name
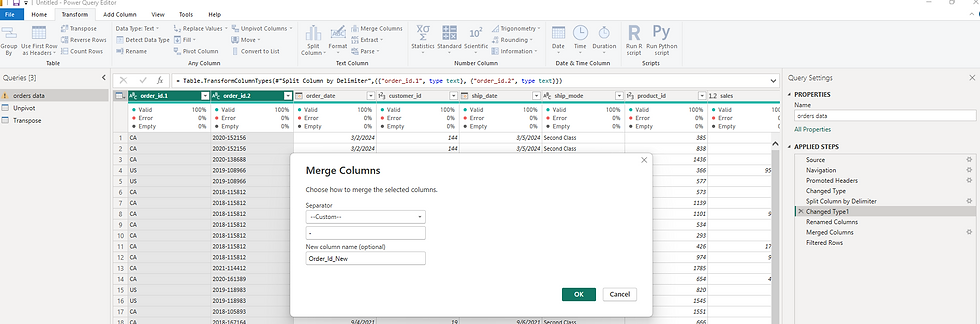
We will get following output

In ribbon, next is add column
Transform Tab vs. Add Column Tab
Transform Tab: Changes are made in-place to existing columns. it means whatever changes we do in transform tab it will do changes in same column
Add Column Tab:
Use Add Column when you want to preserve original data and apply logic or calculations in a new column. It generates new columns based on transformations,
we used add column mostly such as:
Custom Column
Conditional Column
Index Column
Rounding Operations
Data Type Correction
Ensuring each column has the correct data type is critical. Incorrect data types can lead to:
Broken relationships
Invalid measures
Misleading visuals
You can change data types using the dropdown icon next to each column header.
View Tab Features
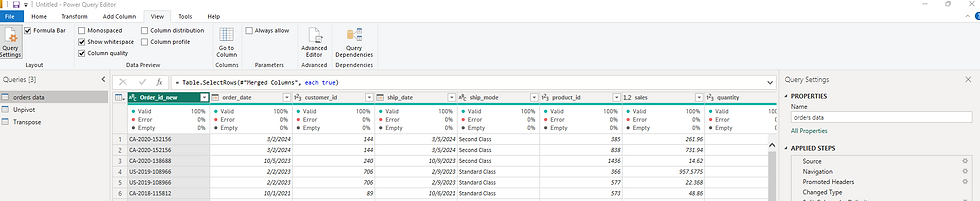
This tab provides profiling tools to understand the quality and structure of your data:
Column Quality
Column Distribution
Column Profile
Whitespace Handling
These tools help identify data issues such as duplicates, missing values, or outliers.
Group by:
Group by is used when we want to aggregate things
Cleaning with Group By
we will see some cleaning options using group by using order dataset
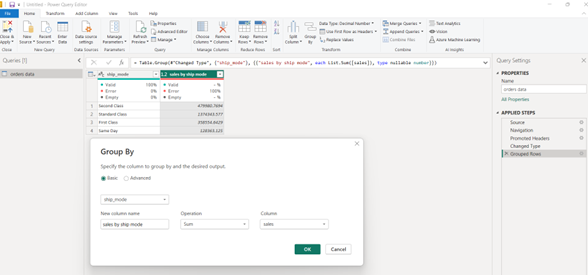
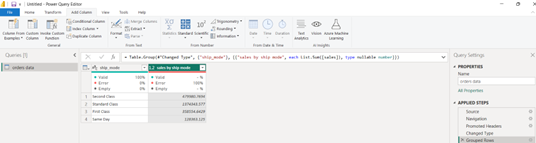
In this dataset suppose we want total sales by ship mode
we can achieve this by group by
Select group by option
In the new group by window appear
Click on basic option,
choose ship mode where u want to do transformation
Give new column name Total sale
Next what operation you want to perform here we want sum of sale so we choose
sum in operation and last on what Column to aggregate
This is how we will get sales by ship mode by group by option
How to use transpose and Unpivot in power query
What is transpose:
when we change rows into column and column into rows
Useful for rotating data structure.
Located under the Transform tab & Transpose.
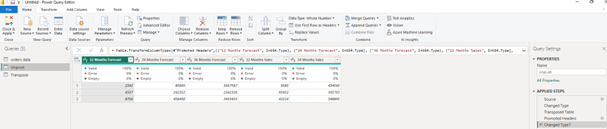
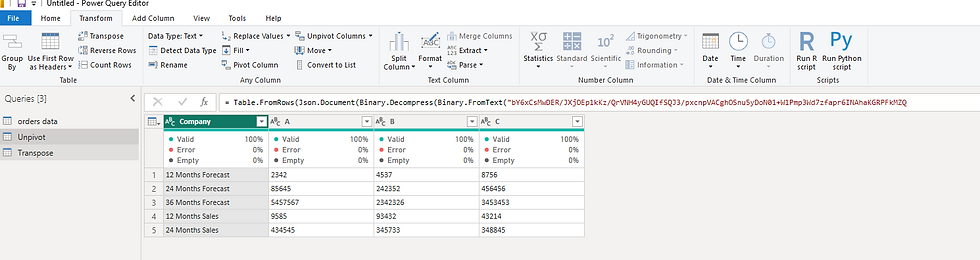
we can understand with this simple example
here in above table all the information is rows, and we want to have it in two column
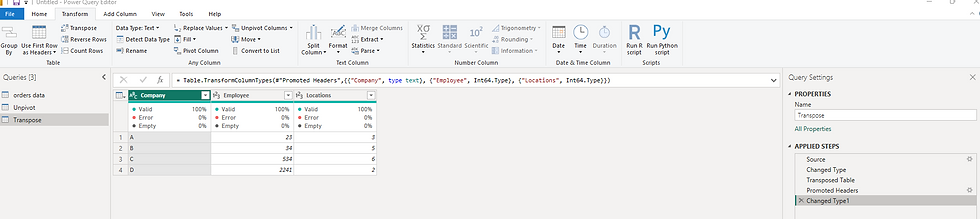
so will go in transform tab click transpose we will get our output all the rows shifted to
column
how to unpivot column
unpivot is changing column into rows we have this table
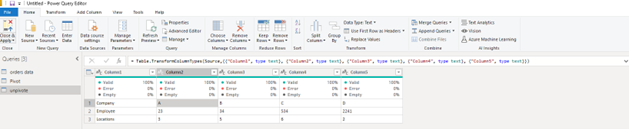
for Unpivoting First we have to do transpose we will get following
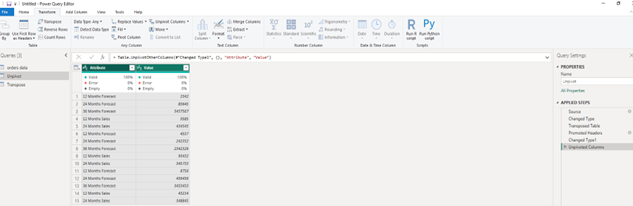
after doing unpivot column we will get desired Output
These are some of the basic transformations you can do in the Power Query .I hope you found this post insightful


