Clean Data to Actionable Insights: Descriptive, Predictive, and Prescriptive Analytics

In my previous blog — Data Cleaning Explained — we explored how raw COVID‑19 survey data can be cleaned and transformed into a meaningful, analysis-ready dataset.
From Clean Data to Analytics
In this continuation, we’ll see how clean data is transformed into actionable insights. Analysts and business decision-makers use descriptive, predictive, and prescriptive analytics to understand trends, forecast outcomes, and recommend actions — all demonstrated using the same dataset from my Python hackathon.
Why Understanding Analytics Matters
To make sense of the analysis, it’s important to understand descriptive, predictive, and prescriptive analytics, how they differ, and who uses them. This framework explains how clean data becomes meaningful insights and supports informed decisions in real-world business and public-health scenarios.
Visualizing Analytics in Python
You can use Python libraries such as Matplotlib, Seaborn, and Pandas to create visualizations for descriptive, predictive, and prescriptive analytics, turning clean data into actionable insights.

Descriptive Analytics – Understanding What Happened
Descriptive analytics summarizes historical data to show what has already happened. It answers the question: “What is going on in the data?”
Common techniques include:
Counts and totals (e.g., total patients, total sales)
Percentages and ratios
Averages (mean, median, mode)
Minimum / maximum values
Trends over time
Monthly Symptom trends
Positive vs negative COVID cases by region
Demographic distribution
Why it matters: Descriptive analytics helps decision-makers identify patterns, spot anomalies, and understand which areas or groups were most affected. For example, executives can see that Toronto had the highest symptom reporting, 12% of respondents in Central Ontario tested positive, and respondents who tested positive reported an average of 3.4 symptoms. These insights allow organizations to make informed decisions about resource allocation, awareness campaigns, and targeted interventions.
What is Top 10 Symptoms among COVID-positive Patients

Fever (12 cases), loss of smell or taste (10), cough (9), chills (8), and shortness of breath (8) are the most frequently reported symptoms, all ranking within the top 10 symptoms observed in the dataset.
Which age groups report the highest emotional distress?

The >65 age group shows the highest “positive” mental‑health impact, meaning they experienced the most beneficial change during COVID‑19. In contrast, the 26–44 group shows the lowest positive impact, indicating they benefited the least. This highlights a clear age‑based resilience gap, with older adults reporting more positive mental‑health effects than working‑age adults.
What is the distribution of need categories in the dataset?

Emotional support is the most common need among those who require help (19.3%). This is a strong signal that mental and emotional well‑being is a major concern during isolation or crisis periods. A meaningful share of respondents report financial support needs, indicating: - income instability, - job loss, - or difficulty affording essentials. Food insecurity affects over 1 in 10 respondents (10.6%) suggesting - limited access to groceries, - affordability challenges, - or transportation barriers. It reinforces the need for food delivery programs, vouchers, or community food hubs. Medication needs are low but critical (1.8%) Takeaways - Focus support programs on emotional, financial, and food‑related needs. - Maintain targeted outreach for the small but high‑risk medication‑dependent group.
Predictive Analytics – Forecasting What Might Happen
Predictive analytics uses historical data along with statistical and machine-learning models to forecast future outcomes. It answers the question: “What is likely to happen next?” By learning patterns from past data, predictive models estimate future risks, trends, and probabilities.
Models and Techniques Used
Logistic Regression to estimate the probability of COVID-19 positivity based on symptoms and exposure factors
Decision Trees to capture non-linear relationships between symptoms, vulnerability, and outcomes
Random Forest to improve prediction accuracy and identify the most influential predictors
Time-series forecasting to project future case and symptom trends over time
These models are trained on historical data and validated using performance metrics such as accuracy and confusion matrices.
Examples from the COVID-19 Dataset
Predicting the likelihood of testing positive based on symptoms, age, sex, and region
Identifying individuals at higher risk of developing moderate or severe symptoms
Forecasting future case counts by region to detect potential hotspots
Why It Matters
Predictive analytics enables organizations to act before problems escalate. For example, if predictive models indicate a potential rise in COVID-19 cases in Toronto, public-health teams can prepare hospital resources, expand testing capacity, and launch targeted awareness campaigns in advance. By anticipating future outcomes, predictive analytics reduces uncertainty and supports proactive, data-driven planning.
How Predictive Connects to Prescriptive
Predictive analytics provides the forecast, while prescriptive analytics uses those forecasts to recommend specific actions. Together, they ensure that decisions are not only informed by data, but also optimized for impact.
Prescriptive Analytics – Recommending Actions
Prescriptive analytics goes beyond understanding past events — it recommends specific actions based on insights from descriptive and predictive analytics. It answers the question: “What should we do?"
Prescriptive analytics is implemented using:
Rule-based recommendations
Optimization and scenario analysis
Decision support systems, which translate analytical insights into concrete actions, such as:
Increasing testing centers in regions predicted to have high COVID positivity
Launching targeted awareness campaigns for vulnerable populations or age groups
Implementing proactive interventions in regions showing clusters of symptoms, such as deploying mobile health units
Making resource allocation decisions, for example ensuring hospitals in high-risk areas are prepared for incoming cases
Why it matters: Prescriptive analytics turns insights into action. Instead of just showing trends or predictions, it provides decision-makers with specific recommendations to improve outcomes, reduce risk, and optimize resources. For example, if predictive models indicate a potential spike in Toronto, public-health teams can proactively deploy testing kits, prepare hospital staff, and communicate preventive measures to residents. This ensures that decisions are data-driven and timely, improving both response and efficiency.
Examples from the COVID-19 dataset:
Which risk factors should be monitored more closely to improve prediction accuracy for future outbreaks?

The pie chart reveals that exposure-related factors such as contact with illness and travel outside Canada are among the most frequently reported, suggesting they should be prioritized in predictive models for outbreak forecasting. The low prevalence of self-isolation (0.6%) may indicate underreporting or behavioral gaps that weaken containment efforts, making it a critical variable to monitor. High prevalence of medical conditions and fever-related symptoms further supports their inclusion as strong predictors of future positivity trend
Are self-isolating respondents experiencing specific needs such as emotional support, financial assistance, food, medication, or other essential services, and what programs can best assist them?

Self-isolating respondents show the highest need for emotional support (42%) and financial support (31%), followed by food (17%), medication (4%), and other assistance (5%). Compared to non-isolating respondents, they experience greater challenges in accessing essentials and managing daily needs. Suggested interventions include grocery or meal deliveries, home delivery of medications, telepharmacy consultations, and counseling or social engagement programs. Targeted support in these areas can help reduce hardship and improve well-being during self-isolation
Which media channels should be prioritized for health messaging based on their reach among high-risk populations?
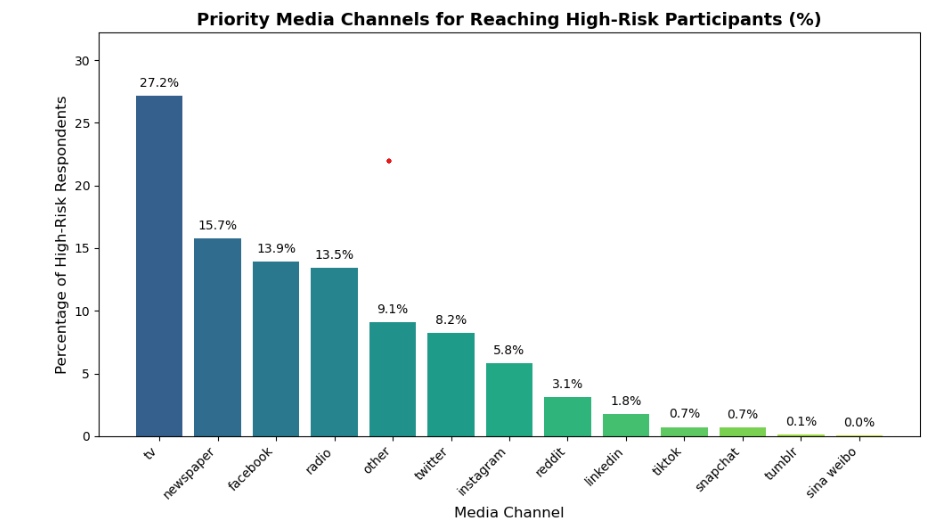
The chart shows the proportion of high-risk participants reached by each media channel, with TV having the highest reach (27.2%), followed by newspapers (15.7%), Facebook (13.9%), and radio (13.5%). This indicates that television is the most effective channel for reaching high-risk individuals, while newspapers remain a strong and trusted information source. To maximize awareness, health messages on TV could use short, clear public service announcements during prime viewing times, while newspapers could feature informative articles, infographics, or sidebars that highlight key preventive measures and resources.
Conclusion
Descriptive, predictive, and prescriptive analytics together form a complete analytics framework that transforms clean data into actionable decisions. Descriptive analytics helps us understand what has already happened by summarizing historical data and identifying key patterns and trends. This foundational step provides clarity and context for further analysis.
Building on these insights, predictive analytics uses statistical and machine-learning models to forecast what is likely to happen next. By identifying future risks, trends, and probabilities, predictive models enable organizations to anticipate outcomes rather than react to them.
Finally, prescriptive analytics converts insights and predictions into concrete actions. It recommends what should be done to improve outcomes, reduce risk, and optimize resources. In the context of COVID-19, this means preparing healthcare systems, targeting high-risk regions, and implementing proactive interventions before situations escalate.
Together, these three types of analytics demonstrate how clean data evolves into meaningful insights and informed decisions. By combining understanding, forecasting, and action, organizations can respond more effectively to real-world challenges and make data-driven decisions with confidence.


