Can great insights come from messy data?

Imagine you are trying to prepare your authentic traditional food, which your mom makes for you, but with some missing ingredients, incorrect measurements, and the wrong spices. No matter how skilled you are, it won’t taste the same. Data analysis works similarly: if the data is messy, even the advanced model can produce misleading results.


Data Cleaning is the process of identifying and correcting errors, inconsistencies, and inaccuracies in a dataset to ensure it is reliable for analysis. It involves preparing raw data so that it accurately represents real-world information. In practice, raw data is rarely perfect; it often contains missing values, duplicate records, incorrect entries, or inconsistent formats.

Without proper data cleaning, analysis can lead to incorrect conclusions, biased predictions, and flawed decision-making. Messy data can hide important patterns, exaggerate trends, or create relationships that do not actually exist. In fact, no amount of sophisticated analysis can compensate for poor-quality data.
“Data cleaning is often seen as a preliminary or tedious step, but it is the foundation of trustworthy analysis” - I agree with this because when we started working for our Python hackathon, data cleaning was our first step, and a tedious step. The dataset we were using was "Flatten_Covid19_Dataset". To clean this dataset, we followed the following steps:
1. Standardization
2. Addressing missing values
3. Addressing outliers
4. Validation
5. Deduplication
Standardization
I would compare standardizing data to the type of ingredient we add in a recipe, for instance, the quality and quantity of ingredients to prepare the recipe as required.
Standardizing by converting the month to a week
We were given three different schemas, which were the surveys taken during different time periods, but they were taken in consecutive months. When we saw the column names of all three schemas, two of the schemas had a “week” column, and the third one had a “month” column for the date time period.
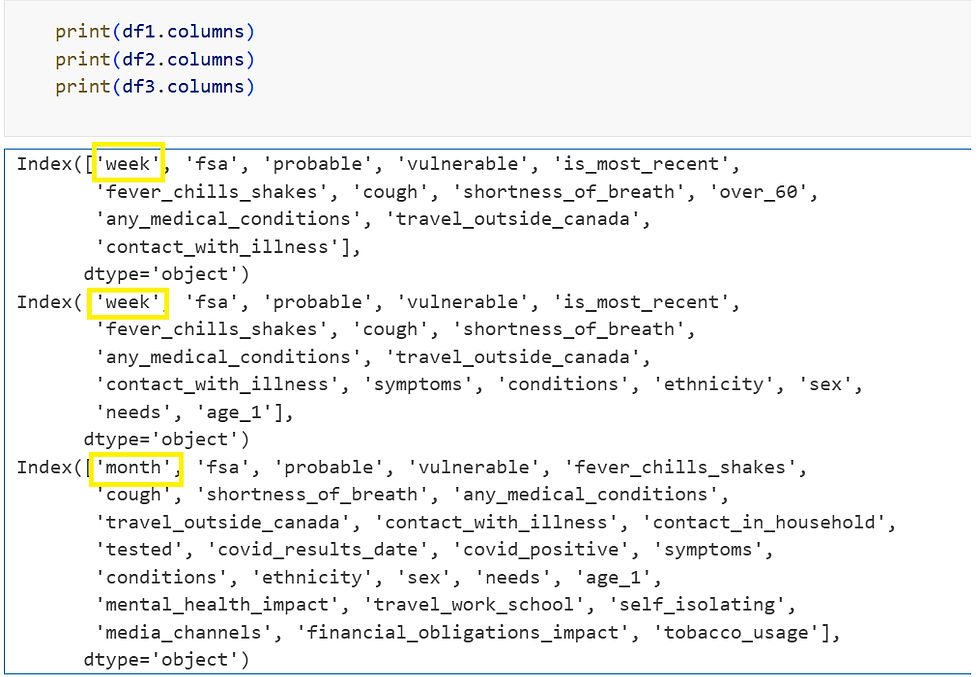
Therefore, we need to standardize by converting all three into either a week or a month. We standardized by converting months into weeks.

Standardizing columns over_60 and age_1
Similarly, schema1 has an "over_60" column representing the age of participants, while schema2 and schema3 has "age_1" column representing the age. To standardize, we will be converting them into an "age" column.
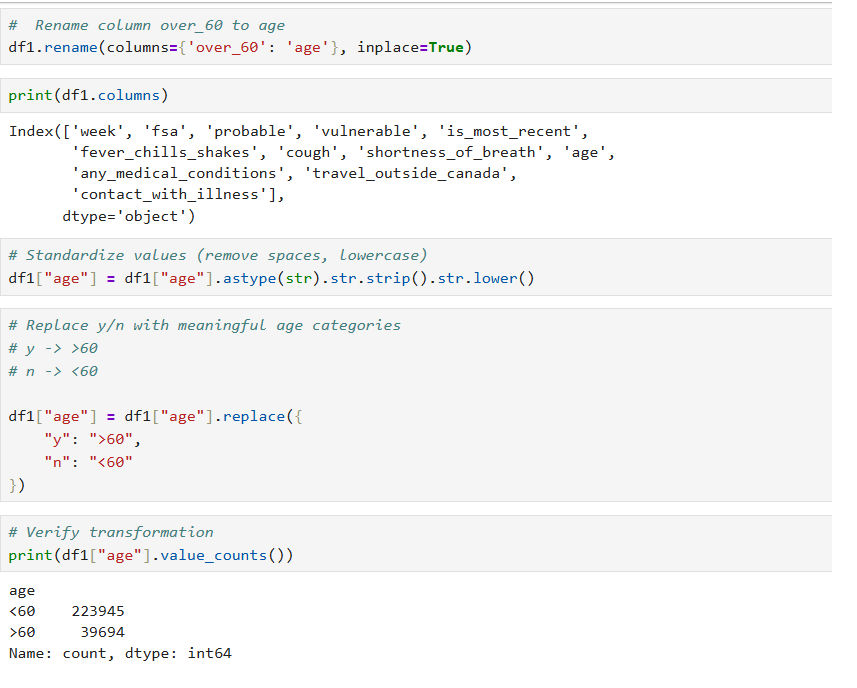
Standardizing by changing the column to age in all three schemas and categorizing them into different age groups, so it is easy to gain insight into which age group got affected by COVID-19.

After standardizing all column names and values, we integrated the data into one data frame.
Addressing missing values
In this section, we are going to handle missing values.
1. Let’s say if we are having the ingredient name in the recipe, but the measurement is missing, should we really drop the ingredient from the recipe? No.
2. Another scenario where the ingredient is mentioned as optional, then we can ignore it.
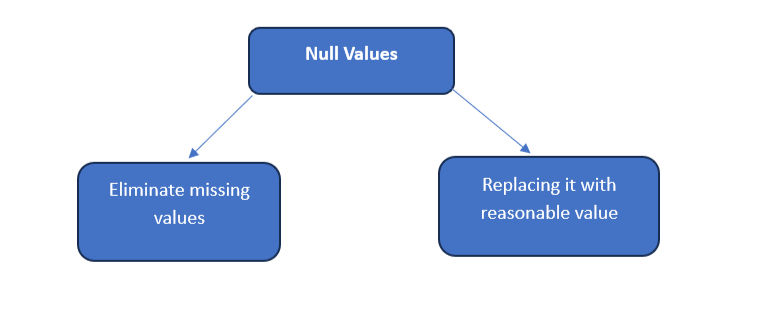
As we merged the data frames, we started noticing a lot of null values because during the beginning of the survey, they didn’t record many constraints. When you find a missing value, you have a choice to either eliminate that entry from the analysis or try to impute a reasonable value to put in its place.
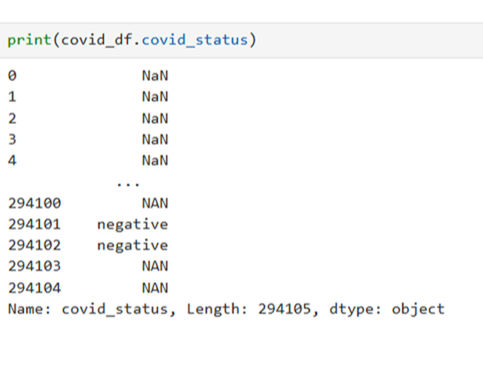
In Flatten_Covid19_Dataset, there was no covid testing in the initial stage of COVID-19. So, we can replace null values (NAN) with not recorded (NR). In this scenario, eliminating all the null values will cause a loss of potential data from the survey.
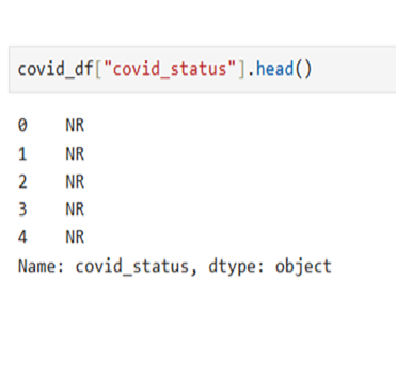
Let’s walk through the next scenario. For this, I am going to take a small sample of data because we didn’t drop any null values in the COVID data; we just handled it reasonably.
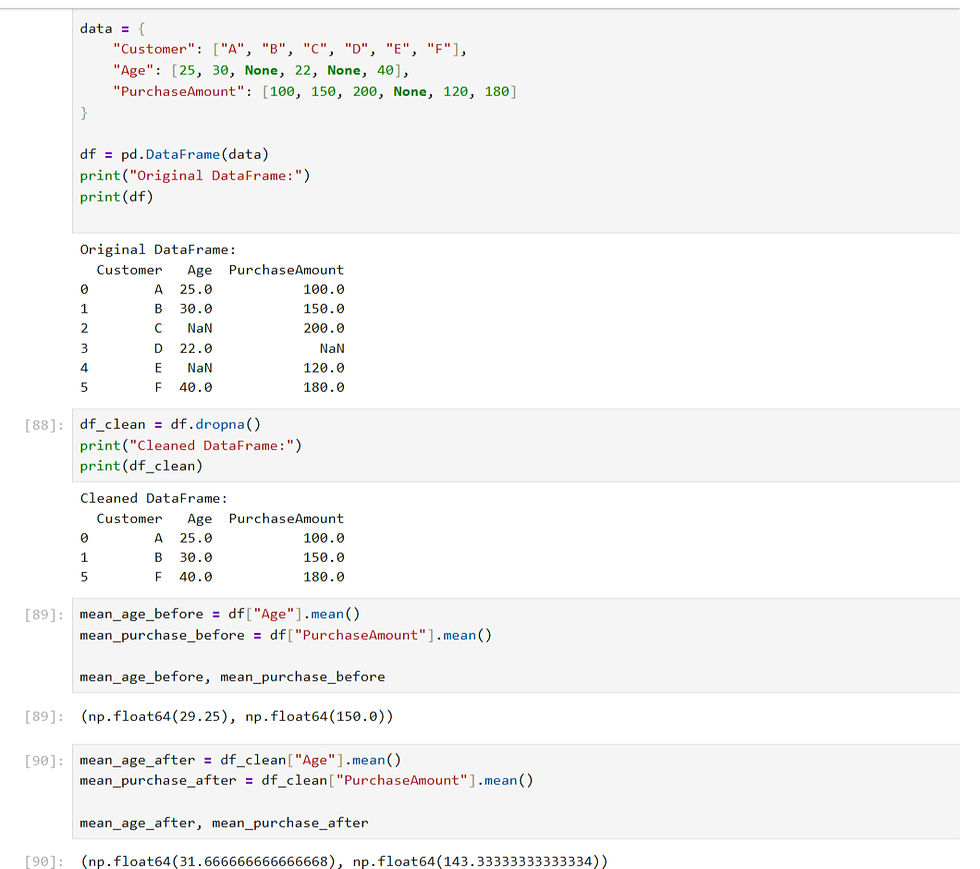
Here in this example data, we are dropping the null values. Why is the analysis NOT meaningfully impacted - Because
The null values were randomly distributed, not concentrated in a specific customer group.
The dataset is small, so even a few nulls shift the mean slightly, but the business conclusion stays the same:
Customers are roughly 30–32 years old on average.
They spend around $140–$150.
In real analytics:
Removing nulls does not harm analysis when:
The missing values are not systematic (not all from one demographic).
The metric you care about is not dependent on the missing rows.
The dataset is large enough that removing a few rows doesn’t distort trends.
Addressing Outliers
First, let me explain outliers with a simple example: you are going to make ten batches of cookies. You are experimenting with different temperature settings and timings. In one of the batch you are setting 500 degrees F and keeping it for 30 minutes instead of 10 minutes, you will get a batch of burnt cookies. This batch is an outlier. Now getting it technically.
Outliers are data points that deviate significantly from the others in a dataset, often caused by errors, rare events, or true anomalies. These extreme values can distort analysis and model accuracy by skewing averages or trends. Outliers are tricky to deal with. Some seeming outliers are actually important data, such as how the stock market responds to crises like COVID-19 and the Global Recession.
Now, let’s see an example of a statistical outlier.
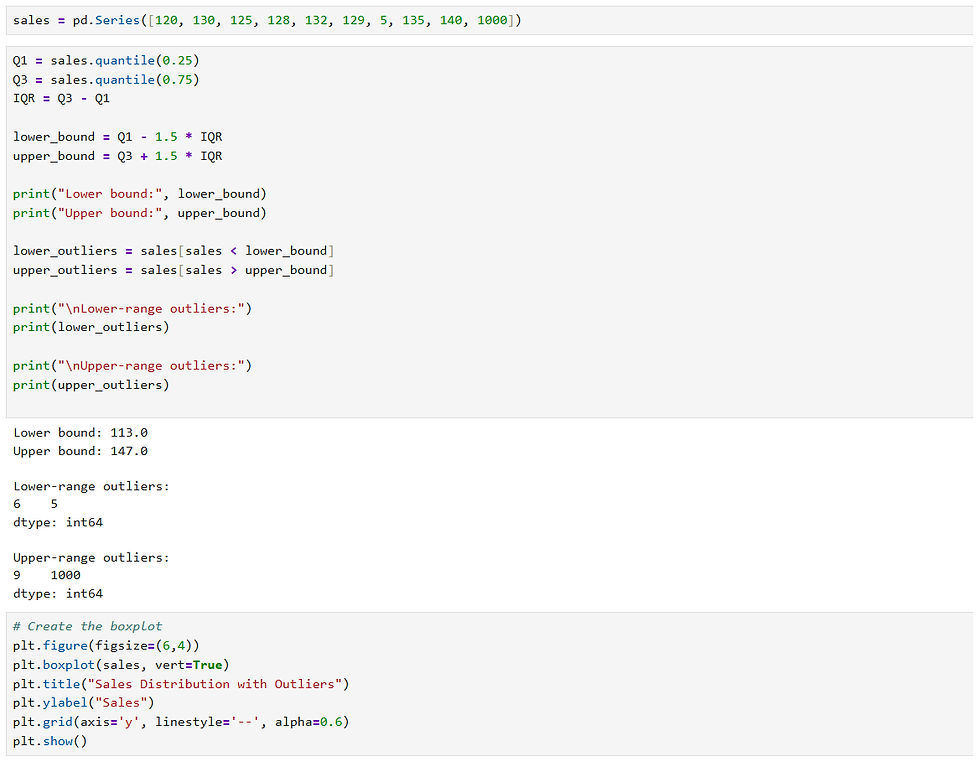
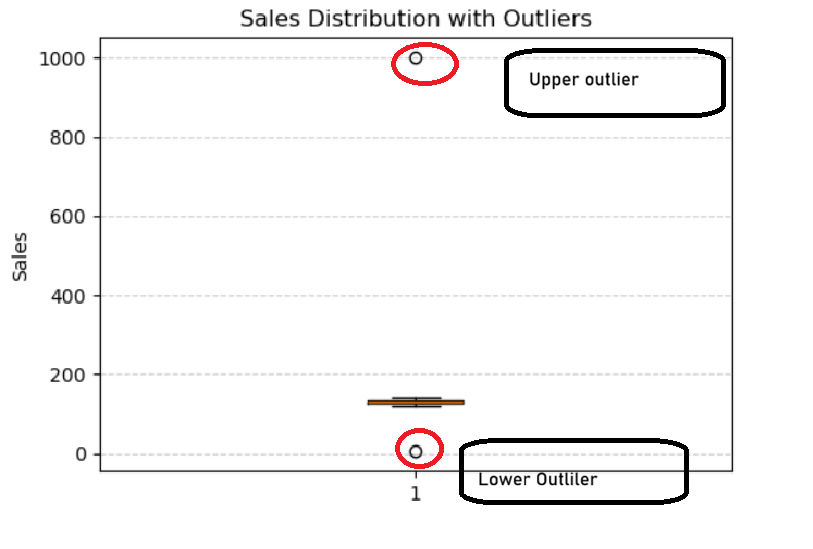
Type of Outlier | Value | Why |
Low-range Outlier | 5 | Far below the normal sales range |
Upper-range Outlier | 1000 | Far above the normal sales range |
Validation
In cooking, validation can be referred to as ensuring recipe consistency, safe and quality food and following the instructions.
A final review at the end of the data cleaning process is crucial in verifying that the data is clean, accurate, and ready for analysis or visualization. Data validation often involves using manual inspection or automated data cleaning tools to check for any remaining errors, inconsistent data, or anomalies.
Addressing inconsistencies
Different types of inconsistencies will require different solutions. Inconsistencies resulting from incorrect data inputs or from typos may need to be corrected by a knowledgeable source. Alternatively, the incorrect data may be replaced using imputation, as if it were a missing value, or removed from the dataset entirely, depending on the circumstances.
Inconsistencies in the formatting of the data can be corrected using some standardization methods. To remove leading and trailing spaces from a string, you can use the .strip() method. The .upper() and .lower() methods will standardize the case in strings. And converting dates to datetimes using pd.to_datetime will standardize date formatting.
You can also ensure every value in the column of a DataFrame is the same data type using the .astype() method.
Other formatting inconsistency corrections you may need to conduct include:
Unit conversion
Email, phone, and address standardization
Removing punctuation from strings
Using value mapping to address common abbreviations
Considering our data, we have value in French, not in English, so is it an outlier since all other values are in English? I pasted, but in this situation, the French value is not a statistical outlier. It’s a data quality inconsistency.
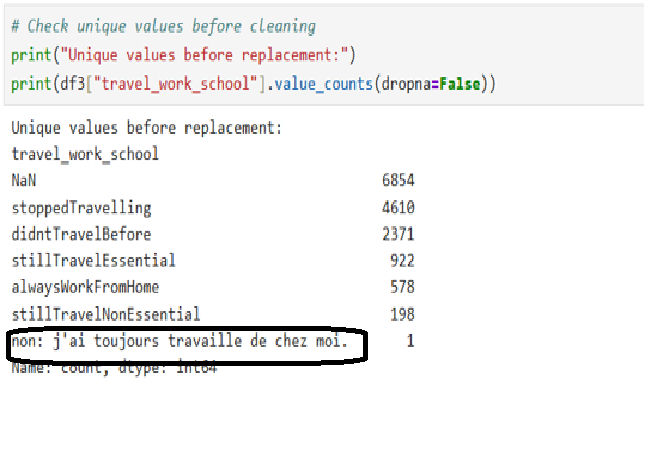
Hence, we just need to standardize. We converted the French value into English.
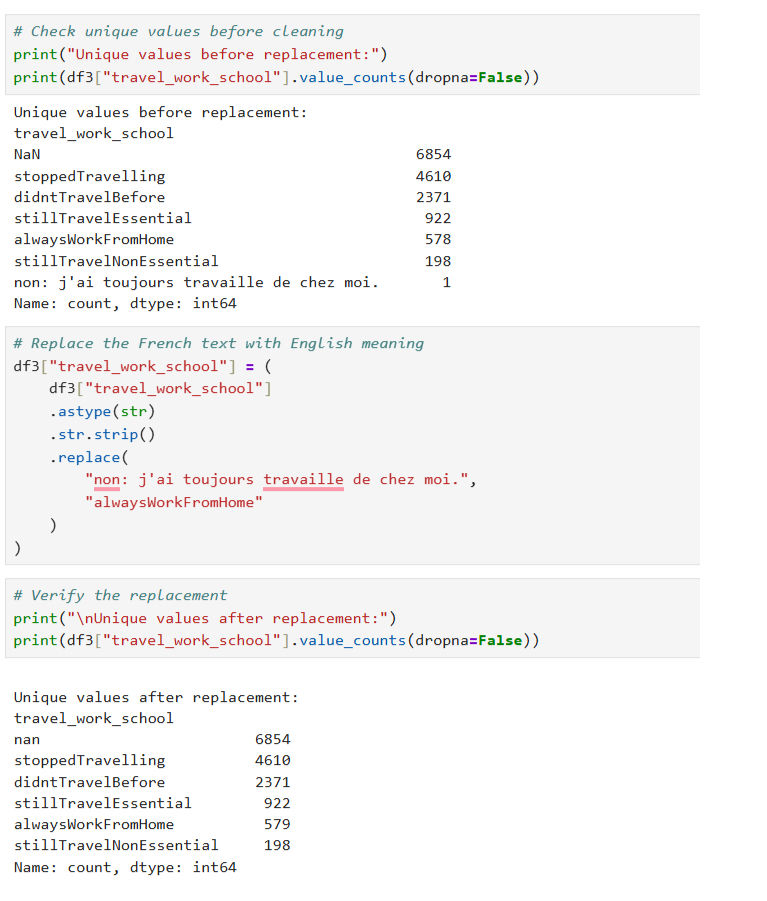
Hence, we just need to standardize. We converted the French value into English.
Deduplication
Duplication is multiple entries of the same ingredient in the recipe.
Data deduplication is a streamlining process in which redundant data is reduced by eliminating extra copies of the same information. Duplicate records occur when the same data point is repeated due to integration issues, manual data entry errors, or system glitches. Duplicates can inflate data sets or distort analysis, leading to inaccurate conclusions.
In the COVID-19 dataset, we considered all the data to be legitimate since we don't have a primary key, such as a SURVEY_ID, to find any duplicates. So I am considering a sample of data to explain deduplication.
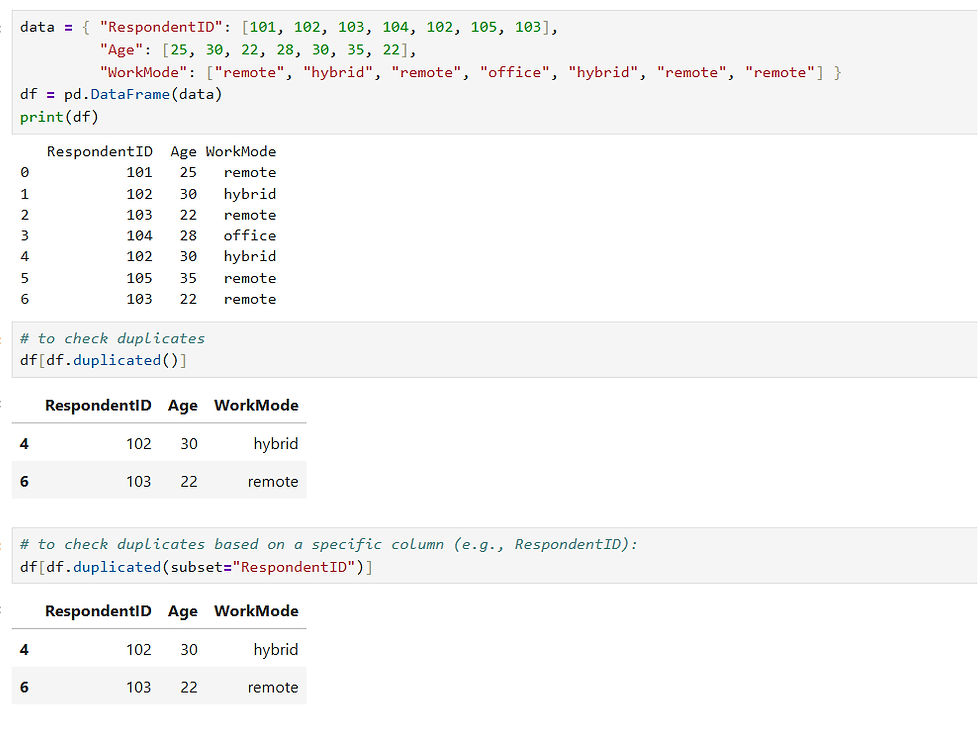
Here, two of the rows are fully duplicated. So we can drop them using drop.duplicates().
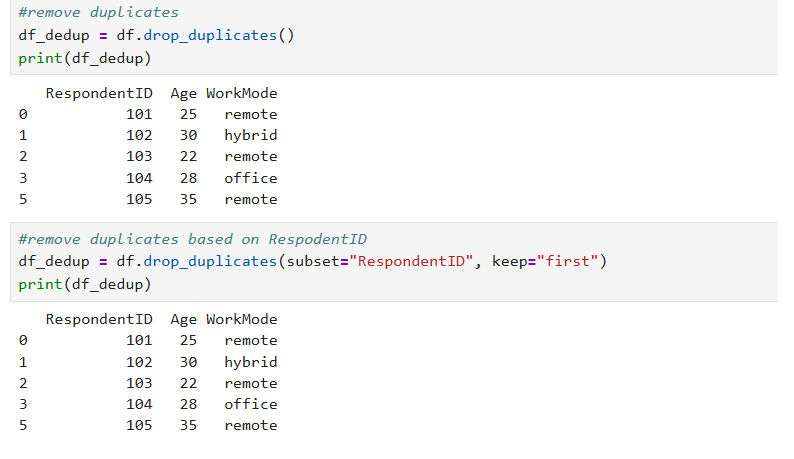
Proceeding with data analysis with duplicates will result in inflated counts, distorted averages, misleading survey results, and biased analysis. Deduplication ensures your dataset reflects true and unique observations.
After completing all the steps of Data Cleaning, we proceeded with descriptive analysis, prescriptive analysis, and predictive analysis. The final step is to produce insights with Python, which is the same as a wonder recipe on the table.

Image credits: https://www.unsplash.com
Thank you


